CoreWeave reports third-quarter results Tuesday, with its conference call at 5 p.m. ET. The central question is whether accelerating AI demand can translate into profitable growth without an increasingly expensive financing burden.
Reassuring execution could fuel a recovery, while disappointing guidance could deepen concerns about the business model. Monday’s $49.01 close, is actually up nearly 20% from last weeks low and lifts the starting point for earnings. With weekly options pricing roughly an 18% move, structure matters as much as direction.
1. What Is the Options Market Pricing?
At Monday’s $49.01 close, the November 13 at-the-money straddle snapshot prices approximately $8.90 of movement, or ±18.2%, producing a $40.11–$57.91 planning range. November 20 options price ±$10.65, or ±21.7%, with a $38.36–$59.66 range.
August’s report produced a 19.3% closing gain and a roughly 23.8% maximum move during the reaction session. That distinction matters: an intraday excursion can threaten a short option even when the closing move appears manageable.
This straddle-based range includes trading through Friday, not exclusively the overnight earnings gap, and should not be interpreted as a precise probability band.
Takeaway: A large implied move raises the hurdle for option buyers, but does not establish an automatic edge for premium sellers.
2. Volatility Skew: Downside Protection Remains Expensive
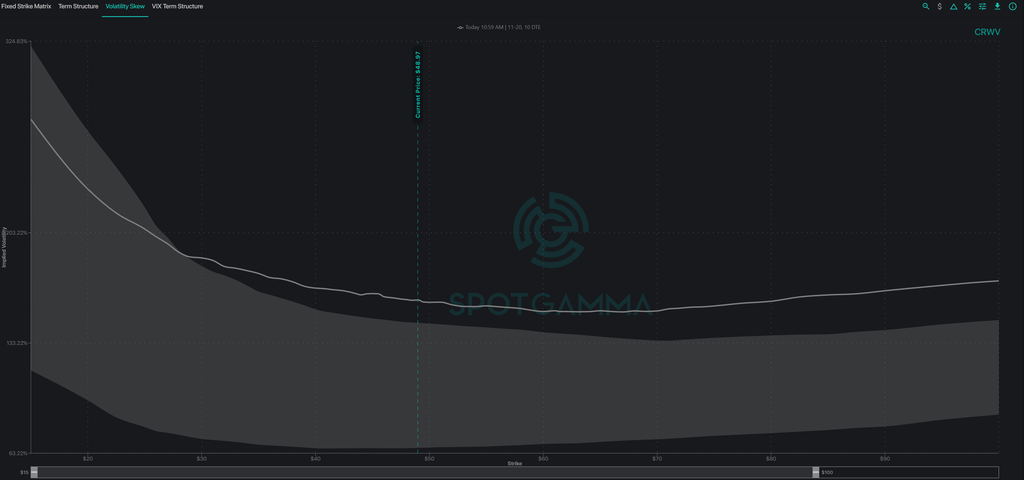
CRWV’s skew shows expensive downside protection and elevated earnings premium across strikes. This snapshot covers November 20 options, with 10 days remaining, at a stock price of $48.97.
The curve falls steeply toward higher strikes before turning upward, creating an asymmetric volatility smile. For example, the $30 and $70 strikes are roughly comparable distances from spot, yet the downside strike carries considerably higher IV. This indicates a larger premium for downside tail risk—not a prediction that shares will decline.
The current curve also sits above the upper edge of the shaded historical band across much of the near-money and upside region. SpotGamma defines that shading as the historical 10th–90th percentile range for comparable days to expiration, indicating unusually elevated pricing within the selected lookback.
Outright put buyers face both expensive downside skew and potential post-earnings volatility compression. A put debit spread can offset some premium by selling a lower strike with higher IV. Selling puts outright still exposes traders to substantial earnings-gap risk.
3. Dealer Gamma: $50 Upside Test, $44 Downside Risk
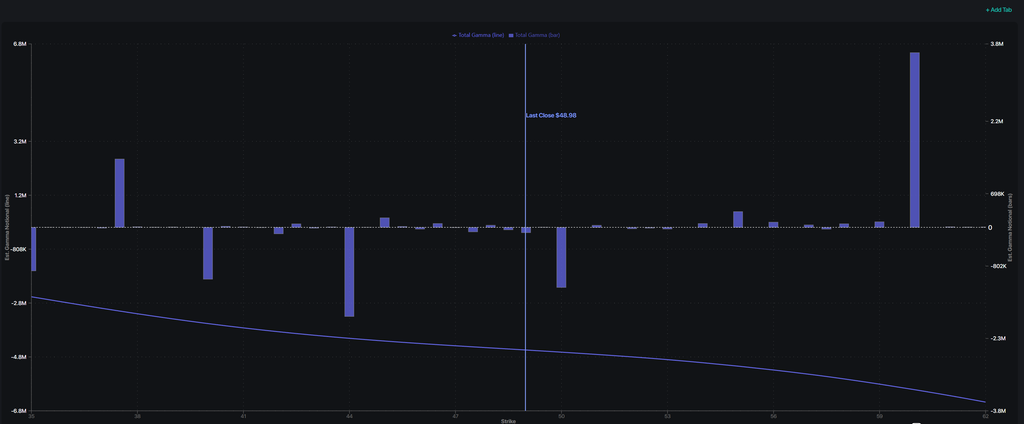
SpotGamma’s map shows negative aggregate dealer gamma, anchored to a $48.98 last close. The total-gamma curve remains below zero throughout the displayed range from $35 to $62, with no aggregate gamma flip visible.
Three levels stand out:
- $50: A substantial negative-gamma concentration that could amplify movement through this nearby strike.
- $44: The largest negative-gamma concentration displayed, highlighting potential downside acceleration rather than dependable support.
- $60: The largest positive-gamma concentration, offering potential upside stabilization without making aggregate gamma positive.
Takeaway: Dealer hedging could reinforce the earnings reaction in either direction. Refresh the map after the announcement, as the stock gap, volatility compression, and position changes can reshape these exposures.
4. Fundamental Catalysts: Converting Backlog Into Cash
Ahead of Tuesday’s report, Earnings Whispers lists approximately $3.54 billion in revenue and a $1.17 adjusted loss per share. Revenue expectations imply roughly 159% annual growth; EPS estimates vary by provider. CoreWeave ended June with approximately $104 billion in revenue backlog, excluding more than $25 billion of commitments added early in Q3. Recognition remains subject to delivery and service-availability requirements.
Three questions matter:
- Capacity: Are power, data centers, and GPUs becoming revenue-producing infrastructure on schedule?
- Margins: Is additional revenue translating into operating income after depreciation and infrastructure costs?
- Financing: Can management fund expansion on terms that preserve shareholder returns?
Second-quarter adjusted EBITDA was $1.51 billion, but adjusted operating income was just $128 million and net interest expense reached $640 million. That gap explains why an impressive EBITDA headline cannot settle the profitability debate.
Takeaway: My focus is the quality and funding of growth; a larger backlog alone would leave key questions unanswered.
5. Three Post-Earnings Scenarios
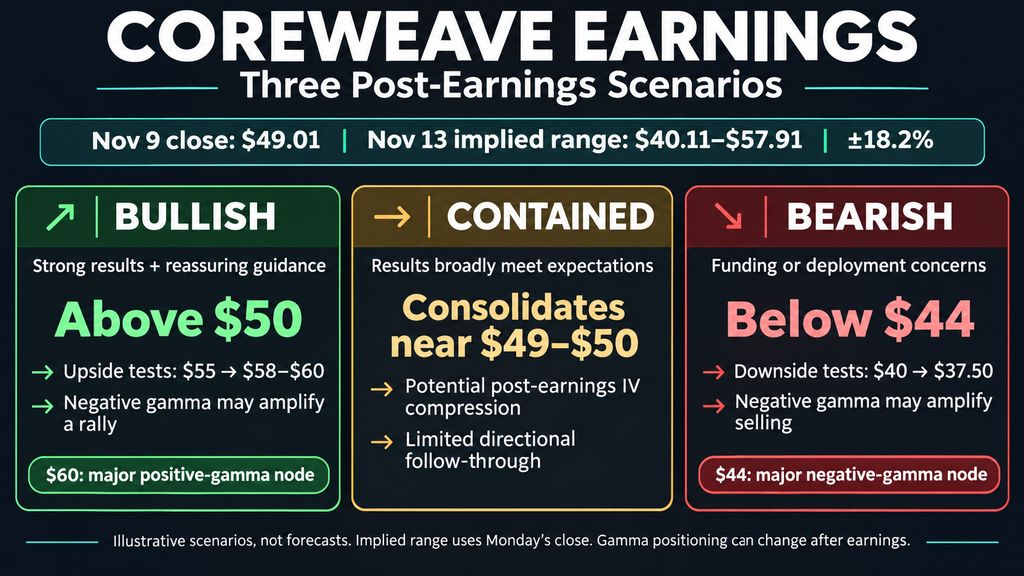
These zones use Monday’s closing reference and November 13 straddle pricing.
- Bullish: Strong guidance and sustained trading above $50 could bring $55, then $58–$60, into focus.
- Contained: Consolidation near $49–$50 could favor volatility compression and limited directional follow-through.
- Bearish: Funding or deployment concerns could pressure shares below $44, exposing $40 and potentially $37.50.
6. Options Trade Idea: Post-Earnings Bull Call Spread
After earnings, a bull call debit spread could express a recovery thesis if guidance is constructive and CRWV establishes a trend move above $50.
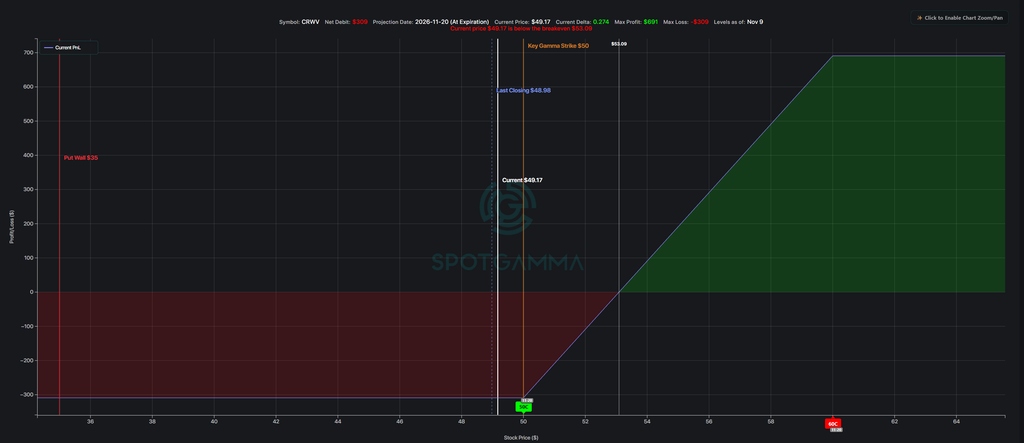
Illustrative structure: Buy the November 20 $50 call and sell the November 20 $60 call, targeting a net debit of no more than $3 per share, or $300 per spread.
At a $3 debit, maximum loss is $300, maximum profit is $700, and expiration breakeven is $53, excluding fees. The $3 limit is an entry criterion, not a verified execution quote. Favorable maximum-payoff arithmetic alone does not establish positive expected value.
Pass if the spread exceeds the debit limit or shares gap near or above $60. Manage both legs together before expiration to avoid assignment complications.
Final Thoughts
CoreWeave’s test is whether exceptional AI demand can support durable shareholder returns. Compare the reaction with the implied move, refresh the dealer map, and require execution evidence before treating a rebound as a lasting change in trend.