Tuesday’s CPI report arrives amid a pullback in technology stocks and renewed uncertainty surrounding the AI trade. A cooler inflation reading could ease pressure on Treasury yields, while another upside surprise may reinforce expectations for further Fed tightening.
For SPX traders, the bigger question is whether the inflation surprise will be powerful enough to trigger a sustained move in a market already dominated by negative gamma positioning.
What Wall Street Expects
The Bureau of Labor Statistics releases October CPI on Tuesday, November 10, at 8:30 a.m. ET.
Economists surveyed by Bloomberg expect:
- Headline CPI: +0.3% month over month, down from September’s +0.6%.
- Core CPI: +0.2% month over month, compared with +0.3% previously.
September’s headline acceleration was heavily influenced by energy. Gasoline prices jumped 9.1%, accounting for more than half of the monthly increase, while shelter rose 0.4%. Annual headline inflation reached 3.7%, and core inflation stood at 2.6%.
There is also an unusual reporting wrinkle: because October 2025 CPI data were largely unavailable following the federal government shutdown, the BLS will not publish October 2026 year-over-year changes for most series. That puts even more attention on the monthly numbers and their underlying components.
A cooler headline print would be welcome. But with energy capable of swinging the headline reading, core inflation will likely carry more weight in the market’s interpretation.
Beyond the headline, shelter and core services remain important indicators of persistent inflation, while goods prices may reveal whether businesses are passing along higher costs. A softer core reading driven by broad-based moderation would be more constructive for equities than a headline decline explained primarily by gasoline.
Why the Fed Makes This Report Different
The Federal Reserve raised its policy range to 3.75%–4.00% in September and left rates unchanged in October.
Following Friday’s stronger employment report, which showed 165,000 jobs added and unemployment at 4.1%, futures markets were pricing roughly an 80% probability of another quarter-point Fed increase in December as of November 9.
This creates an asymmetric setup: a modest inflation improvement may not remove a December hike from expectations, while a hot core reading could push markets toward pricing an even more restrictive Fed path into 2027.
Watch the two-year Treasury yield for the immediate policy response, then the ten-year yield, dollar and Nasdaq for confirmation.
If equities sell off while yields climb, inflation is likely driving the repricing. If yields fall but technology stocks remain weak, the problem may be broader risk appetite rather than CPI alone.
Why Negative Gamma Raises the Stakes
Tuesday’s CPI release arrives against a potentially fragile options-positioning backdrop.
SpotGamma’s latest SPX gamma map shows estimated aggregate gamma remaining negative across the displayed strike range, with SPX closing near 7,377. In this environment, dealer hedging flows may reinforce directional moves rather than suppress volatility.
Notable strike-level gamma concentrations sit near 7,350–7,400, with additional positioning clusters around 7,500–7,600. These represent areas to monitor as the market reacts, although they are not guaranteed support or resistance levels.
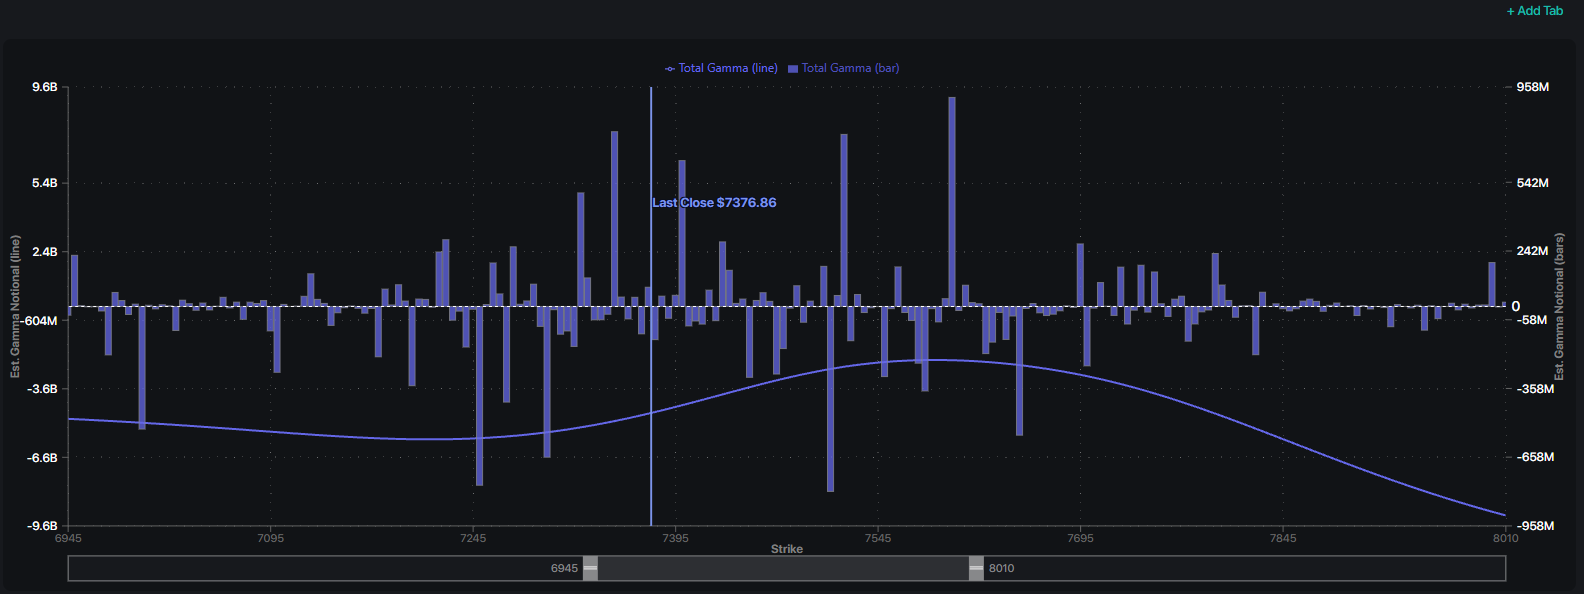
The key distinction is that the market remains in a negative gamma regime even at higher strikes on the chart. A meaningful inflation surprise could therefore produce sustained momentum in either direction.
Traders should compare the reaction against SpotGamma’s implied move and independently identified options levels, using Treasury yields to confirm whether the initial directional move has a macro foundation.
Implied Volatility Compresses Ahead of the Report
Implied volatility has come in sharply on Monday. As of 3:24 p.m. ET, SpotGamma’s SPX term structure shows implied volatility below both Thursday’s and Friday’s levels for every expiration beyond today’s.
The largest declines sit in the front of the curve. On Thursday, expirations covering the rest of CPI week were priced near 25% implied volatility. By Friday, they had eased to roughly 20%–22%. As of Monday afternoon, those same contracts trade at roughly 17.5%–18.5%, as much as seven volatility points below Thursday’s levels.
The November 20 monthly expiration shows a similar pattern, falling from roughly 23% on Thursday and 21% on Friday to about 16.5%. Early December expirations have eased from near 20.5% and 19% to about 15%.
The compression is smaller in longer-dated contracts. Mid-January expirations sit near 15.5%, down from roughly 18.5% on Thursday and 18% on Friday. As a result, the curve has flattened considerably from last week’s elevated front end.
Outside of today’s expiring contracts, Tuesday’s CPI expiration is the high point on Monday’s curve at about 18.5%, indicating options traders are still paying a premium for event risk, though far less than they were late last week.
Even after Monday’s decline, implied volatility remains elevated by recent standards, holding above the 90th percentile of its range over the past three months across most expirations. Options are cheaper than they were late last week, but they are still priced richly relative to recent history.
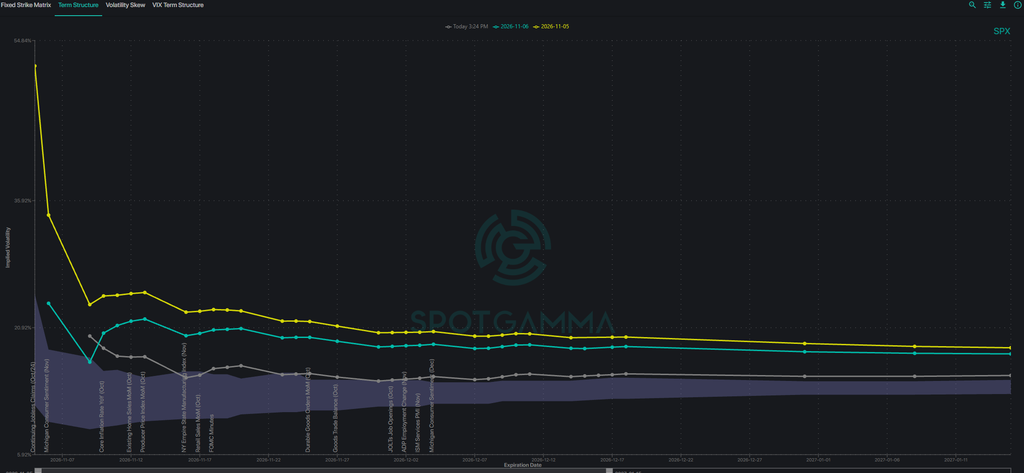
Lower implied volatility means the options market is now pricing a smaller CPI reaction than it was just one session ago. With aggregate gamma still negative, a print that pushes SPX beyond that reduced range could force volatility to reprice higher quickly.
Three Scenarios for Tuesday
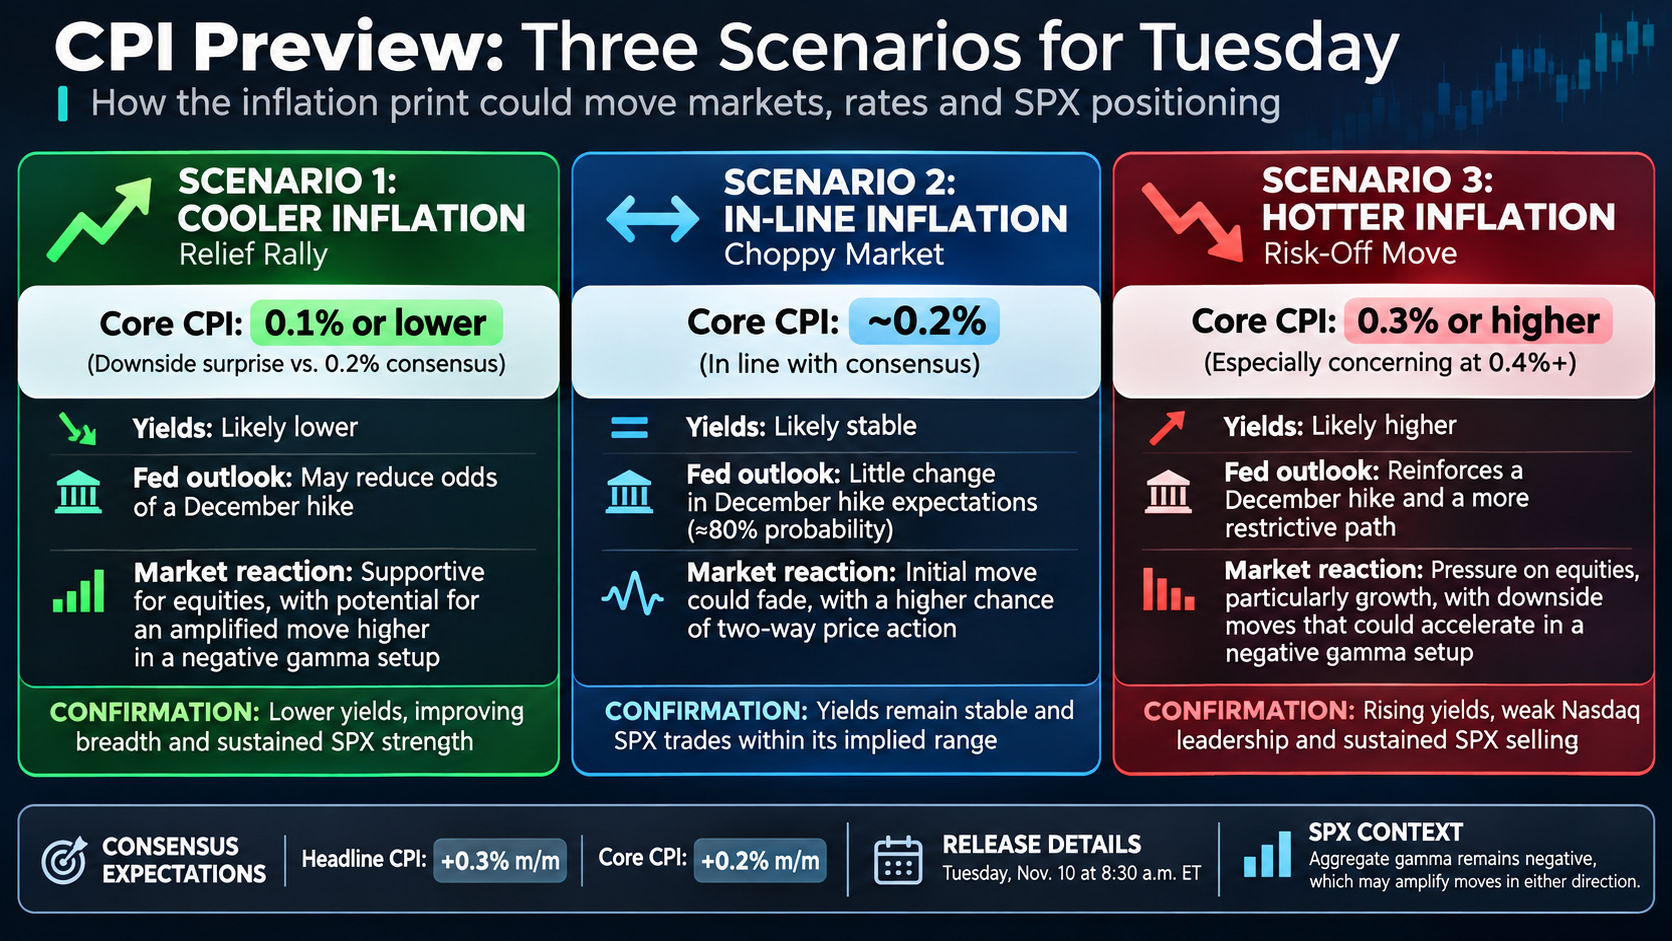
Scenario 1: Cooler Inflation Sparks a Relief Rally
Core CPI of 0.1% or lower would represent a meaningful downside surprise versus the 0.2% consensus, particularly if shelter and services also moderate.
Falling Treasury yields could weaken expectations for a December Fed hike and support a rebound in technology stocks. With aggregate gamma remaining negative, dealer hedging could amplify upside momentum.
Confirmation: Lower yields, improving breadth, and sustained SPX strength.
Invalidation: Equities fail to rally despite declining yields.
Scenario 2: In-Line Inflation Produces a Choppy Market
Core CPI near 0.2%, alongside headline inflation around 0.3%, would largely match expectations and potentially leave the Fed outlook unchanged.
The initial reaction could fade as traders reassess the details, although existing options positioning leaves room for larger-than-expected swings.
Confirmation: Stable Treasury yields and SPX trading within its implied range.
Invalidation: A sustained breakout accompanied by a decisive move in yields.
Scenario 3: Hotter Inflation Triggers Another Risk-Off Move
Core CPI of 0.3% or higher, particularly a 0.4%+ reading, could reinforce Fed tightening expectations if shelter and services inflation remain sticky.
Rising yields and a stronger dollar would likely pressure growth stocks. With SPX already in a negative gamma regime, renewed selling could accelerate as dealer hedging reinforces downside momentum.
Confirmation: Rising yields, weakening Nasdaq leadership, and sustained SPX selling.
Invalidation: Yields stabilize and buyers quickly reclaim lost ground.
The Trading Takeaway
Tuesday’s CPI reaction will hinge on more than the inflation surprise itself. Treasury yields should reveal whether the report materially changes Fed expectations, while SpotGamma’s positioning levels can help traders determine whether the resulting SPX move is likely to fade or accelerate. With negative gamma already dominating the market structure, the potential for volatility expansion remains elevated in either direction.