• Skip to content
  • Skip to primary sidebar

SpotGamma™

S&P 500 Stock Market Gamma Trading Levels Based on Options Open Interest

  • Subscribe Now
  • Products
  • Blog
  • FAQ
  • Contact
    • About
  • Members
    • Account
    • Portal
    • Equity Hub 2.0

Aug 14 2019

Dealer Futures Flow 8/14/19

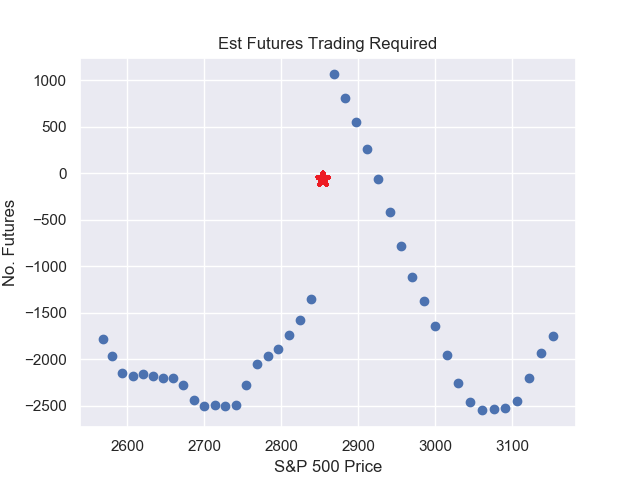
Here is a chart estimating the futures action with the S&P500 at 2850. If markets head lower it looks like dealers will sell more futures, compounding the move down. The same works in a rally, but instead of selling those dealers will be buying. All this flips when/if the market moves over the VFLIP line of 2920.

gamma trading by options market makers
Dealers/Market Makers Estimated Futures Trading. Dots are 50bps increments.

As an addendum to this, here is a futures liquidity chart from Goldman Sachs. You can see that in the current market only $10 million notional is required to move the market one tick. 1000 S&P Emini Futures is about $140 million dollars. That would have impact.

Goldman Sachs S&P500 futures Emini liquidity.
  • Click to share on Twitter (Opens in new window)
  • Click to share on Facebook (Opens in new window)
  • Click to share on LinkedIn (Opens in new window)
  • Click to share on Reddit (Opens in new window)

Written by tenten · Categorized: Market Analysis · Tagged: futures, gamma, market makers, options, S&P500, SPX

Primary Sidebar

Popular Posts

spotgamma-sidebar-weaponized-gamma-sidebar
spotgamma-sidebar-yolo-trade
did-softbank-weaponize-options-gamma-whale
goldman-gamma-op-ex-option-driven-equity-flow
spotgamma-on-the-market-huddle

Categories

  • Dark Pool (1)
  • Market Analysis (262)
  • SpotGamma Updates (4)
  • Stock (47)
  • Trade (3)
Follow @spotgamma on Twitter!
  • Subscribe
  • Disclaimer
  • Account
  • Portal

©2021 TenTen Capital LLC DBA SpotGamma