• Skip to main content
  • Skip to primary sidebar

SpotGamma™

S&P 500 Stock Market Gamma Trading Levels Based on Options Open Interest

  • About
  • Pricing
  • Academy
  • Resources
    • Tool Demos
    • Case Studies
    • Blog
    • Support Center
    • Free Daily Report
    • Free Trading Tools
      • Options Profit Calculator
      • SPX Gamma Exposure
      • Implied Earnings Moves
      • Volatility Ranking
    • Free Training
    • Report Card
  • Login

S&P500

Dec 18 2020

TSLA S&P500 Add Shenanigans

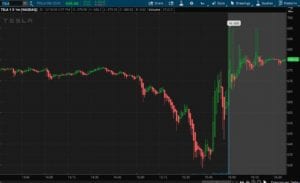
Note that last candle, which closes the stock at $695 – the days high. Did someone really just pay $695 for $TSLA shares? pic.twitter.com/zi5UrJopbq — Joe Weisenthal (@TheStalwart) December 18, 2020 TESLA TRADING VOLUME AT 180 MILLION AS STOCK SETTLES AT END OF SESSION, TURNOVER AT $122 BILLION — *Walter Bloomberg (@DeItaone) December 18, 2020 […]

Written by SpotGamma · Categorized: Market Analysis, Stock · Tagged: S&P500, TSLA

Dec 16 2020

TSLA into the S&P500

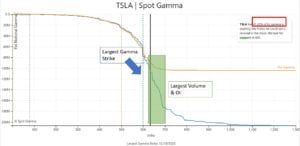
In TSLA the largest gamma area was $600 heading into today. The stock traded down to $605 earlier this AM, $620 now. The largest volume & OI region is >=$650 44% of TSLA gamma exp on close of12/18, by which time ~$50bn of TSLA stock needs to be bought by S&P indexers

Written by SpotGamma · Categorized: Market Analysis, Stock · Tagged: expiration, gamma, S&P500, TSLA

Dec 10 2020

TSLA Timeline into the S&P500 Add

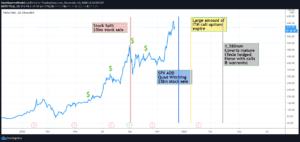
TSLA will be added to the S&P500 Index next week, and will be approximately 1.5% of the index. We covered the mechanics of this add, here. The chart below highlights the key recent events, and some relevant future dates. The “$” markets indicate where Musk has received a bonus in the form of TSLA options. […]

Written by SpotGamma · Categorized: Market Analysis, Stock · Tagged: options delta, S&P500, TSLA

Nov 17 2020

TSLA Added to the S&P500

TSLA Added to SPX

Last night the S&P announced that TESLA (TSLA) would be added to the S&P500 (SPX) Index by Monday 12/21. What this effectively means is that anyone that has funds (pensions & other large asset managers) indexed to the S&P500 will need to purchase TSLA stock, and will sell whichever stock(s) TSLA is replacing(TBD). As TSLA […]

Written by SpotGamma · Categorized: Market Analysis, Stock · Tagged: S&P500, TSLA

Oct 19 2019

Gamma Effect Seen In Index Movement

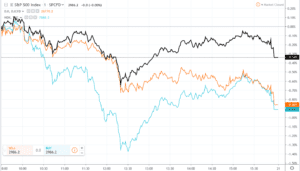
Lets classify this as what it is: speculation (at best) but its quite interesting on days like yesterday when the S&P is down only 34bps while Nasdaq and DOW were down ~90bps. Yes, Boeing (BA) hurt the DOW in particular but that wouldn’t explain the Nasdaq performance. The theory that should be bookmarked here is […]

Written by SpotGamma · Categorized: Market Analysis · Tagged: dow, gamma, nasdaq, S&P500

Aug 23 2019

FED, TRUMP, Gamma Trap: Crazy Trading Day 8/23/19
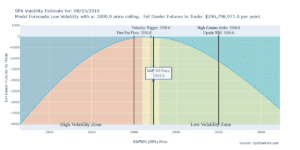
Fed gave a speech that was “volatility dampening” at 10AM. Trump didn’t like what the Fed had to say so he started tweet-trashing the Fed and China triggering a “gamma trap“. Stock markets were just at the volatility trigger level of 2920 (black horizontal line) so the gap down flipped the trigger and dealers were […]

Written by SpotGamma · Categorized: Market Analysis · Tagged: dealer positioning, gamma trap, long gamma, open interest, options, S&P500, short gamma, SPX, SPY

Aug 19 2019

Gamma Market From 8/16/19

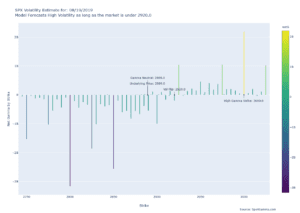
Volatility will continue to reign until (if) the market recaptures 2920. There is a ton of fuel ready to burn and one headline (or tweet) will send the market flying. The only recommendation that is safe here is to not sell any options, being short volatility is very dangerous here, as a >3% rally is […]

Written by tenten · Categorized: Market Analysis · Tagged: futures, market gamma, market makers, open interest, options gamma, S&P500, SPX, SPY

Aug 14 2019

Dealer Futures Flow 8/14/19

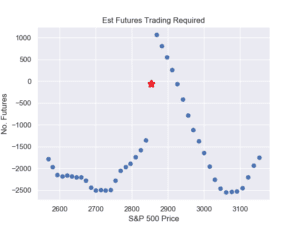
Here is a chart estimating the futures action with the S&P500 at 2850. If markets head lower it looks like dealers will sell more futures, compounding the move down. The same works in a rally, but instead of selling those dealers will be buying. All this flips when/if the market moves over the VFLIP line […]

Written by tenten · Categorized: Market Analysis · Tagged: futures, gamma, market makers, options, S&P500, SPX

Primary Sidebar

SpotGamma-Subscriber-Signup-Banner

  • Volatility Has Compressed. What Happens Next?
  • Another SpaceX Unlock, and Why $150 Still Caps the Stock
  • Options Exchange Monitor — Week of August 15, 2026 (36 SEC notices, 2 CFTC, 0 EDGAR)
  • GEX Levels for SPY, QQQ, ES and NQ: Using Index Gamma in Any Product
  • How to Trade GEX Levels: A Practical Guide to Gamma-Based Trading
  • youtube
  • x
  • Privacy Policy
  • Disclaimer
  • Terms & Conditions
  • Support Center
  • Media
  • Contact Us

©2026 TenTen Capital LLC DBA SpotGamma

All SpotGamma materials, information, and presentations are for educational purposes only and should not be considered specific investment advice nor recommendations. Futures, foreign currency and options trading contains substantial risk and is not for every investor. An investor could potentially lose all or more than the initial investment. Risk capital is money that can be lost without jeopardizing one's financial security or lifestyle. Only risk capital should be used for trading and only those with sufficient risk capital should consider trading. Past performance is not necessarily indicative of future results. Testimonials appearing on this website may not be representative of other clients or customers and is not a guarantee of future performance or success.

View Full Risk Disclosure