Macro Theme: |
Key Levels: |
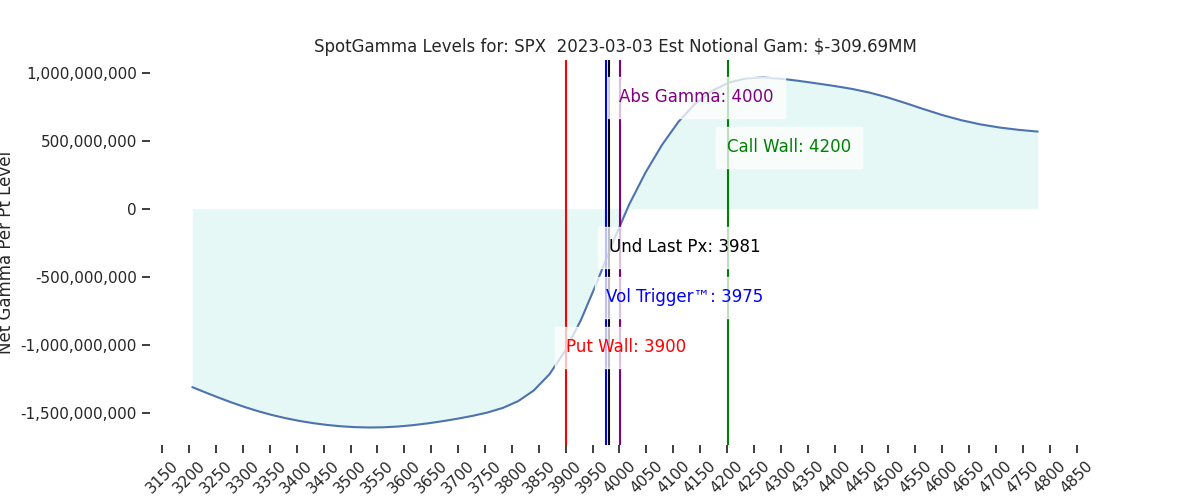
| Macro Note TBA | Reference Price: 3981 SG Implied 1-Day Move: 0.9% SG Implied 5-Day Move: 2.7% Volatility Trigger: 3975 Absolute Gamma Strike: 4000 Call Wall: 4200 Put Wall: 3900 |
| Big Picture | Cash Open | Cash Close |
|
VIX | 19.42 | 18.5 (-0.92) |
|
ES [March futures] | 4005 | 4050 (+45) |
|
NQ [March futures] | 12134.75 | 12317.00 (+182.25) |
Upcoming Market Events
March 10 (Friday at 8:30am EST): Nonfarm Payrolls
March 14 (Tuesday at 8:30am EST): CPI
March 15 (Wednesday at 8:30am EST): PPI
March 17: Monthly Opex (Quad Witching)
March 22 (Wednesday at 2pm EST): Fed Interest Rate Decision
What’s Happening Today in the Market
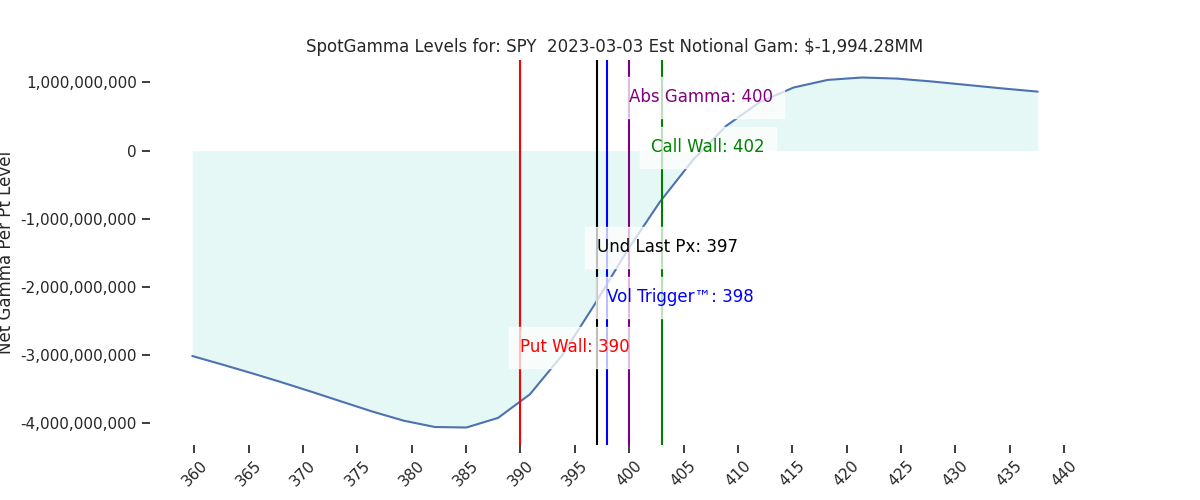
Today, SPY broke above its past few recent highs, which also aligned with the 402 Call Wall today. Below is depiction of renko analysis, which reduces noise and focuses on rotations by only printing a new block after it moves up or down so much.

One of the most powerful features that we provide to members (of all tiers) are the combos. The Combo 1 level is the strongest, and the Combo 2 level is the second strongest etc. Today, we can see that the market traded in a perfect range, traveling from Combo 1 to Combo 2 on ES. What this tells us specifically is the combined OI for matching levels on SPY and SPX is the second strongest where it is depicted in red (Combo 2), and it is the strongest where it is depicted in green (Combo 1), which is precisely where it closed for the day.

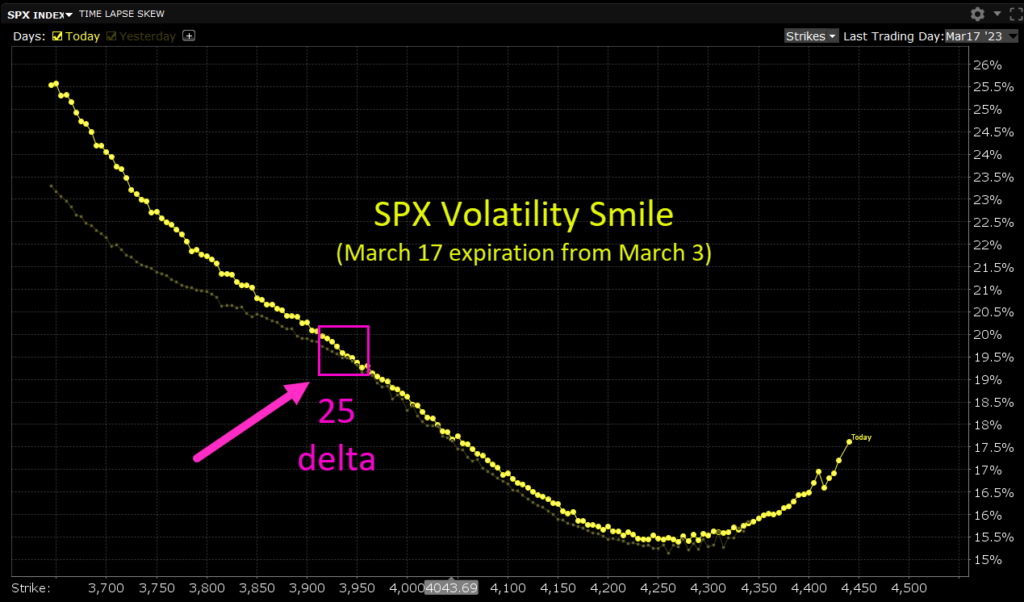
In addition to this rally in equities today, implied volatility got smashed. In particular, put skew was crushed beginning at about 25 delta, while call skew was mostly intact between a balance of call overwriting to fade the rally and new calls being bought as the major indices broke through previous resistance. Overall, calls were dominant today.
Gamma Spotlight
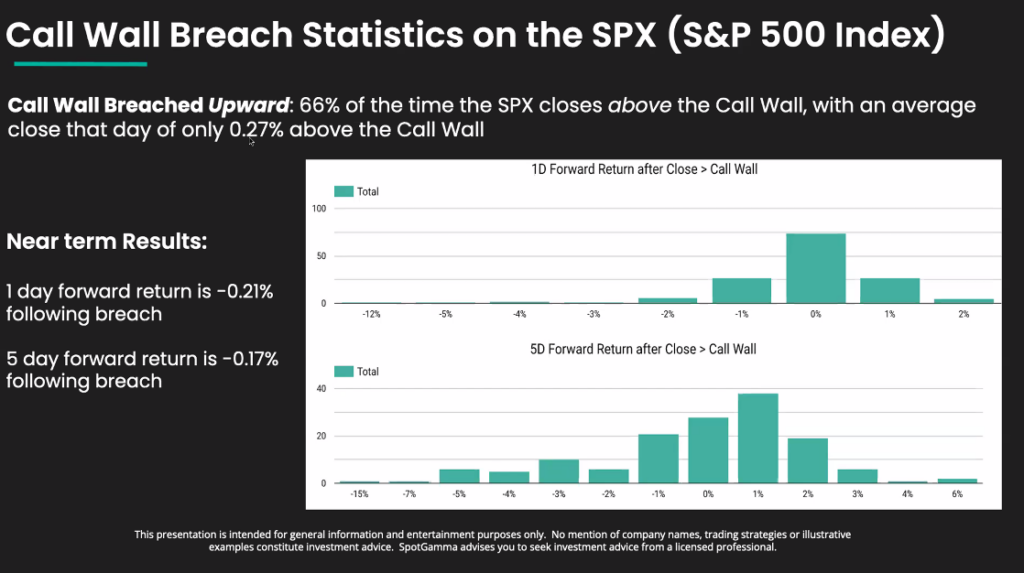
From our webinar on Wednesday, here is part of the type of research we have been doing. If models are not actively data-driven, then they are anecdotal at best. This is why we are continually working behind the scenes to understand how price interacts with our key levels, and how such relationships change over time and in different types of market regimes.
Today we breached a Call Wall on SPY, and this is our updated research on what happens when Call Walls get breached: They tend to move up a little bit higher on that same day (about 0.27% on average), but then drop down on the next day (by about -0.21%) and then are down by about -0.17% over the next five market days. This is based on a sample size of several hundred.
Largest Catalysts of the Day
Bullish: Non-Manufacturing PMI was a beat this morning at 55.1 actual (with consensus at 54.5 and previous at 55.2).
Neutral: The Fed speakers had mixed remarks today, which were not strict enough to undo the very strong sentiment which was initiated yesterday by Atlanta Fed President Bostic.
Neutral: There are geopolitical concerns about China potentially arming Russian, but they are still too distant and tangential to be in play. However, it is a remote threat which is a slice of longer-term volatility pricing, and something the news bots will no doubt be scanning for developments on.
Details on the Catalysts
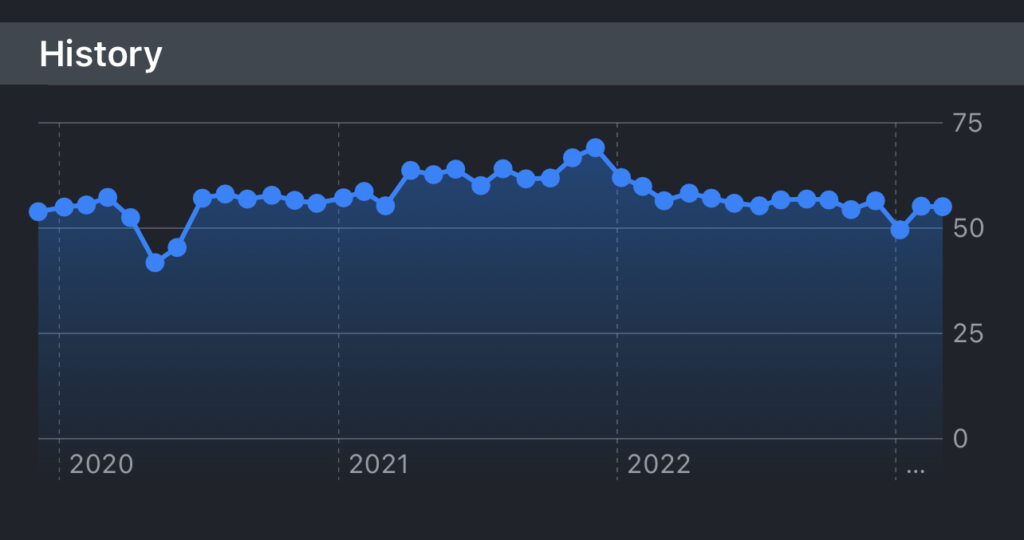
Non-manufacturing PMI is considered an indication of economic growth if above 50, which was was cleanly over today. But as can be seen here, the trend is softly downward. This bigger picture is in line with expectation for the Fed to be lightly tapping the breaks on the economy. But being above 50 also shows a positive outlook for future growth.
Among the mixed comments from Fed speakers today, they bought themselves some flexibility by saying how they will adjust the balance sheet drawdown (quantitative tightening) if there is a need to. But the market already knew that.
More on the hawkish side, they reiterated what is also known already, which is how tight the labor market is, and how that is a problem for inflation.
And on the straight bearish side, Dallas Federal Reserve President Logan said how “Markets are falling behind in their ability to support the treasury market during times of stress.” And also, “The US financial sector is increasingly vulnerable to shocks.” The market was able to power through their remarks, but her comments did build a case for at least some minor exposure to long volatility.
What the Models Are Telling Us
For our Equity Hub view of SPY (from the Put & Call Impact tab), we can see how the Call Wall fell to 402 here. But from this depiction, we can see that oscillating back to 410 and even 420 would be probable if some more buyers step in there. We consider it a bullish development whenever any of our key levels move up.

.
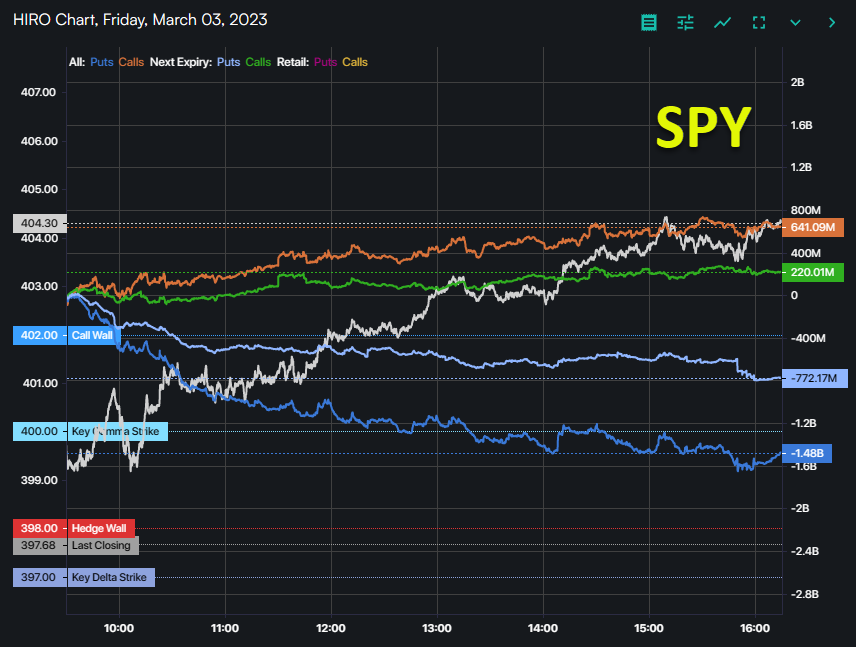
And taking a look at HIRO, we can see that calls were dominant today: Calls on all expirations are shown in orange and zero DTE calls are shown in green. Below, the puts are in blue.
Market Structure
A look at the volatility smile on SPX shows that IV% took a strong hit for all strikes beyond 25 delta. Meanwhile call IV% remained firm. The most likely explanation here on the call side is that some traders saw the action today and perceived it as a great opportunity to write some calls, namely to protect their long-only equity positions. And others wanted to buy calls on momentum. That type of trade off would keep call IV% in place.
However, despite that IV crush on puts, this view here of all upcoming monthlys shows how much room there is still left for IV to crush on quad witching (March 17), and on both sides of the smile.

Conclusion

Market gamma was negative today at -0.42, which is less negative than it was on Monday at -1.14. It is likely that this rally today will have pushed us back into positive market gamma territory. This is something we will look out for on Monday. More market gamma means more market liquidity, which helps to keep equities trading in a narrower range. It follows that credit spreads become relatively safer, but must be understood as having worse reward/risk despite their higher winrates. It is also generally prudent to wait and make sure that a positive market regime is holding.
And as always, it is safer to proceed with small changes to your positioning so as not to face market shocks. And the less size you have, the more control you have over your portfolio and the less easily you can get shaken out. These are all important considerations to make when framing your trading decisions, which are always going to be based on probabilities rather than certainties. However, if we are to retain a positive market gamma regime here, then this would present different types of trading opportunities in the futures, down to the behavior of market shocks from binary market events, which have much less protection against extreme moves when in a negative gamma market regime.
| SpotGamma Proprietary SPX Levels | Latest Data | SPX Previous | SPY | NDX | QQQ |
|---|---|---|---|---|---|
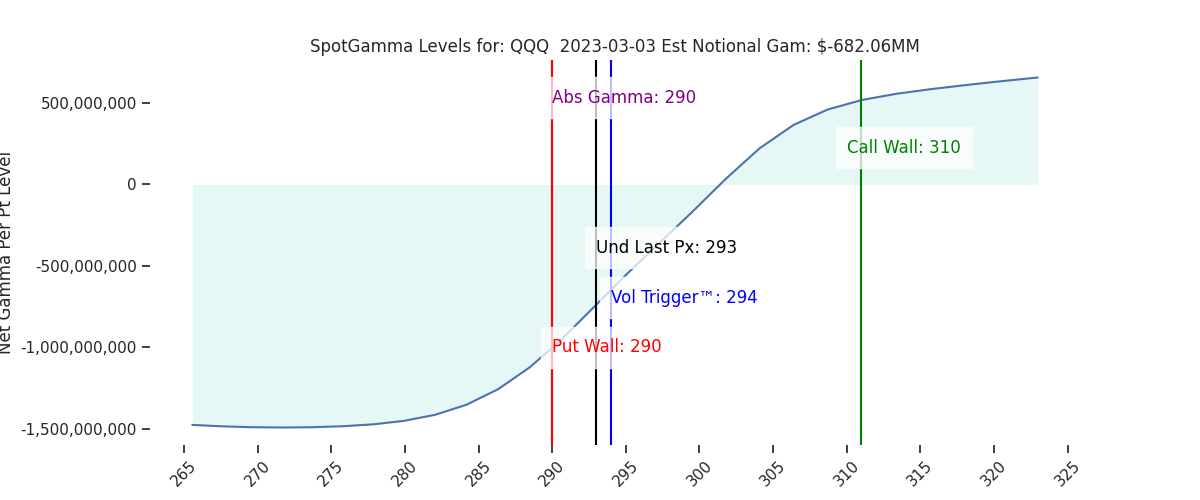
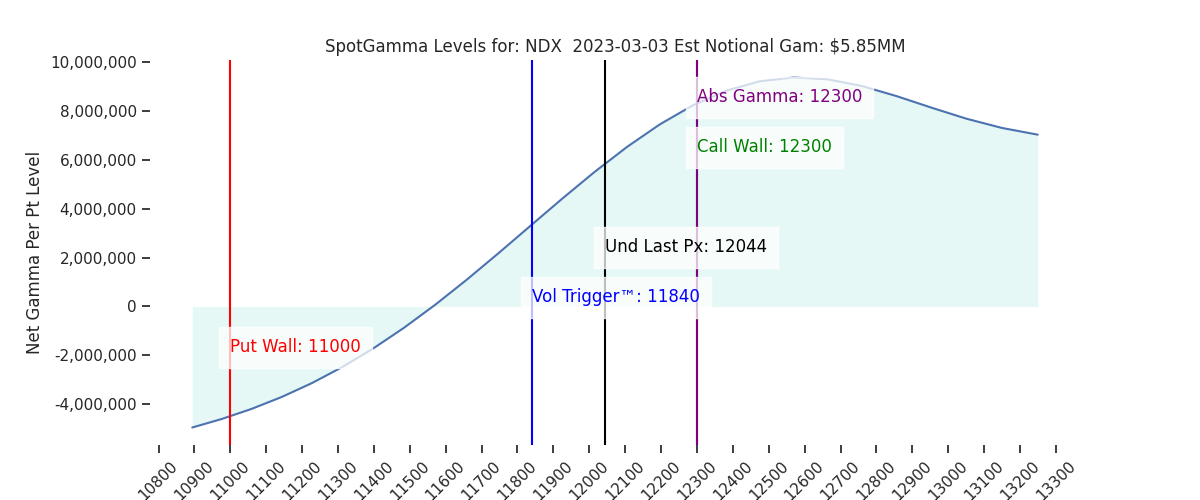
| Reference Price: | 3981 | 3981 | 397 | 12044 | 293 |
| SG Implied 1-Day Move: | 0.9%, | (±pts): 36.0 | VIX 1 Day Impl. Move:1.23% | ||
| SG Implied 5-Day Move: | 2.7% | 3970 (Monday Reference Price) | Range: 3863.0 | 4077.0 | ||
| SpotGamma Gamma Index™: | -0.42 | -1.14 | -0.39 | 0.03 | -0.10 |
| Volatility Trigger™: | 3975 | 4000 | 398 | 11840 | 294 |
| SpotGamma Absolute Gamma Strike: | 4000 | 4000 | 400 | 12300 | 290 |
| Gamma Notional (MM): | -310.0 | -310.0 | -1994.0 | 6.0 | -682.0 |
| Call Wall: | 4200 | 4200 | 402 | 12300 | 310 |
| Put Wall: | 3900 | 3900 | 390 | 11000 | 290 |
| Additional Key Levels | Latest Data | Previous | SPY | NDX | QQQ |
|---|---|---|---|---|---|
| Zero Gamma Level: | 3993 | 3993 | 406.0 | 11489.0 | 305 |
| Gamma Tilt: | 0.92 | 0.88 | 0.63 | 1.42 | 0.69 |
| Delta Neutral Px: | 3978 | ||||
| Net Delta (MM): | $1,579,384 | $1,580,510 | $188,423 | $50,761 | $98,600 |
| 25 Day Risk Reversal: | -0.05 | -0.05 | -0.05 | -0.05 | -0.05 |
| Call Volume: | 603,091 | 572,933 | 2,308,596 | 9,664 | 797,035 |
| Put Volume: | 944,874 | 896,211 | 3,442,767 | 8,596 | 1,148,986 |
| Call Open Interest: | 6,247,945 | 6,195,909 | 6,748,534 | 63,403 | 5,029,142 |
| Put Open Interest: | 11,211,174 | 11,020,245 | 13,735,169 | 64,897 | 8,584,829 |
| Key Support & Resistance Strikes: |
|---|
| SPX: [4050, 4000, 3950, 3900] |
| SPY: [400, 398, 397, 395] |
| QQQ: [300, 295, 290, 285] |
| NDX: [13000, 12300, 12000, 11500] |
| SPX Combo (Strike, Percentile): [(4176.0, 75.57), (4149.0, 87.9), (4101.0, 84.79), (4077.0, 76.85), (4065.0, 91.52), (4049.0, 83.21), (4045.0, 75.31), (4029.0, 85.13), (4025.0, 91.62), (4013.0, 77.69), (4005.0, 78.7), (3973.0, 78.8), (3953.0, 85.82), (3949.0, 94.78), (3946.0, 81.29), (3934.0, 84.04), (3926.0, 94.29), (3914.0, 81.8), (3906.0, 92.07), (3902.0, 97.81), (3894.0, 74.86), (3886.0, 77.43), (3874.0, 85.84), (3854.0, 85.65), (3850.0, 92.03), (3826.0, 79.25), (3806.0, 80.54), (3798.0, 96.12)] |
| SPY Combo: [389.85, 379.51, 394.63, 392.24, 390.25] |
| NDX Combo: [12298.0, 11696.0, 11491.0, 11900.0, 11816.0] |
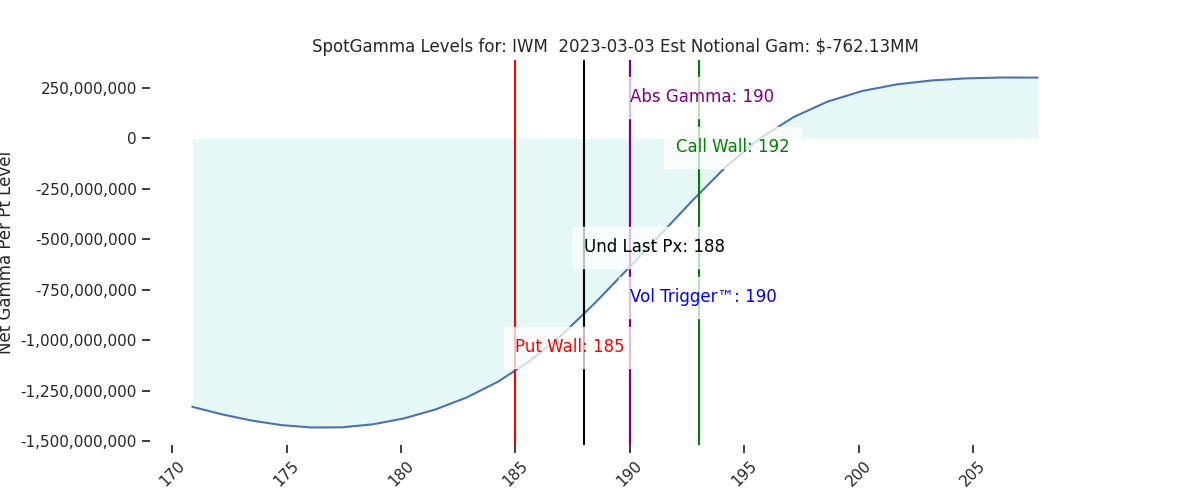
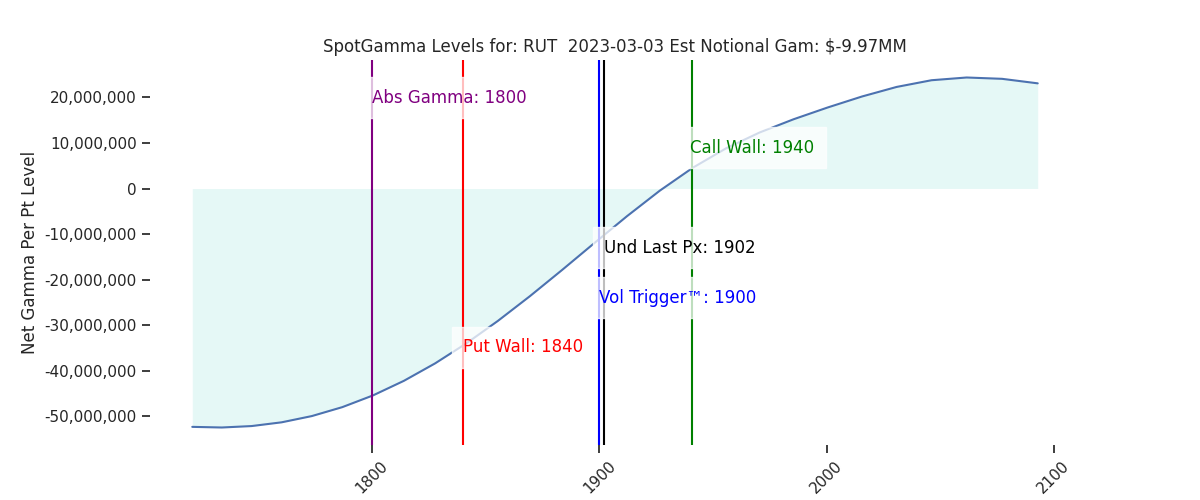
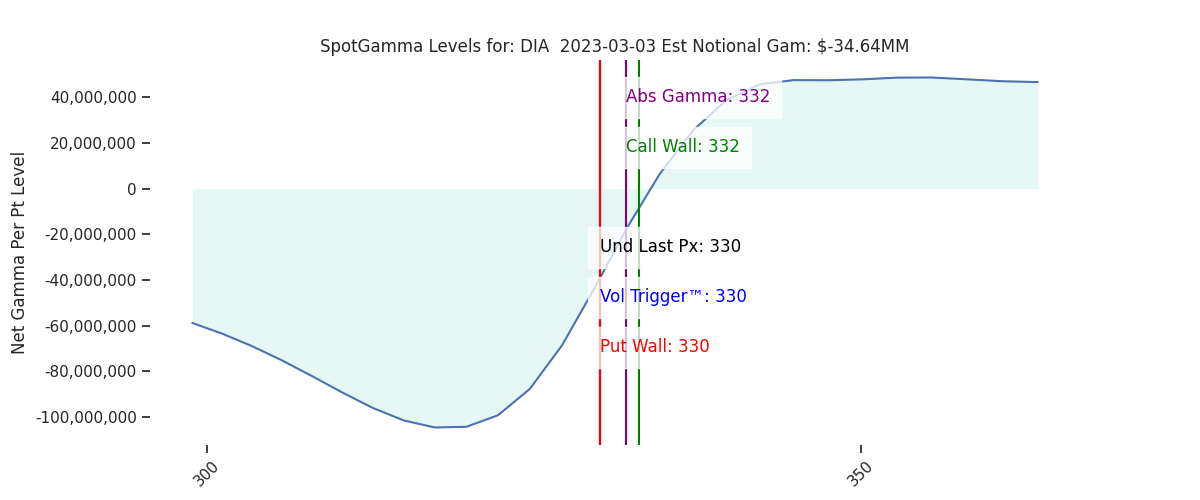
| ©TenTen Capital LLC d.b.a. SpotGamma Please leave us a review: Click Here |
| See the FAQ for more information on reading the SpotGamma graph. |
| SpotGamma provides this information for research purposes only. It is not investment advice. SpotGamma is not qualified to provide investment advice, nor does it guarantee the accuracy of the information provided. This email is intended solely for subscribers, please do not distribute the information without the express written consent of SpotGamma.com. |