For the fourth consecutive week, the S&P 500 has struck records highs. This week’s breach of SPX 7,500 even arrived in the face of hotter-than-expected CPI and PPI prints — data that historically would have triggered a meaningful selloff. The tone shifted somewhat on Friday, as the rally lost steam into monthly OPEX.
The week ahead features NVDA Earnings on Wednesday, May 20, marking the single most significant market event on the calendar. After weeks of elevated call-buying and stretched bullish sentiment, the stage appears set for what could be a meaningful uptick in volatility.
As a demonstration of how the options market reflects the recent exuberance, SpotGamma’s Compass reveals both SPY and QQQ hold a 99% Risk Reversal Rank. This indicates that 1-month calls are extremely expensive compared to puts — a dynamic that can unwind quickly, leaving the market vulnerable to sudden directional moves.
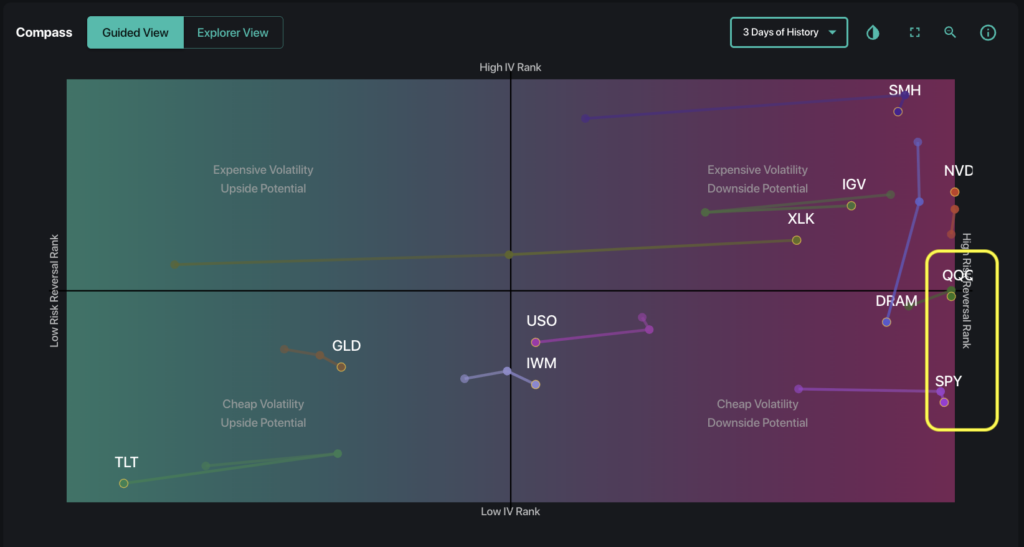
“Spot Up, Vol Up” Returns Ahead of NVDA Earnings
Even as the market achieved new highs, implied volatility (IV) also climbed for SPY, QQQ, SMH, and NVDA. This “spot up, vol up” pattern is unusual.
Typically, implied volatility and spot price are inversely correlated for a given instrument. When both rise together, traders may be paying up for protection even as they chase upside — a sign the market is bracing for expanded volatility.
Attention has shifted squarely to NVDA earnings on May 20, which now carries an implied move of 6%. Overall positioning ahead of earnings remains extremely bullish, with traders continuing to roll NVDA calls into higher strikes.
Traders have shown an overwhelming preference for upside call exposure while demand for downside protection remains extremely limited. As shown in the Volatility Skew curve below, call skew remains elevated relative to its 90-day range.
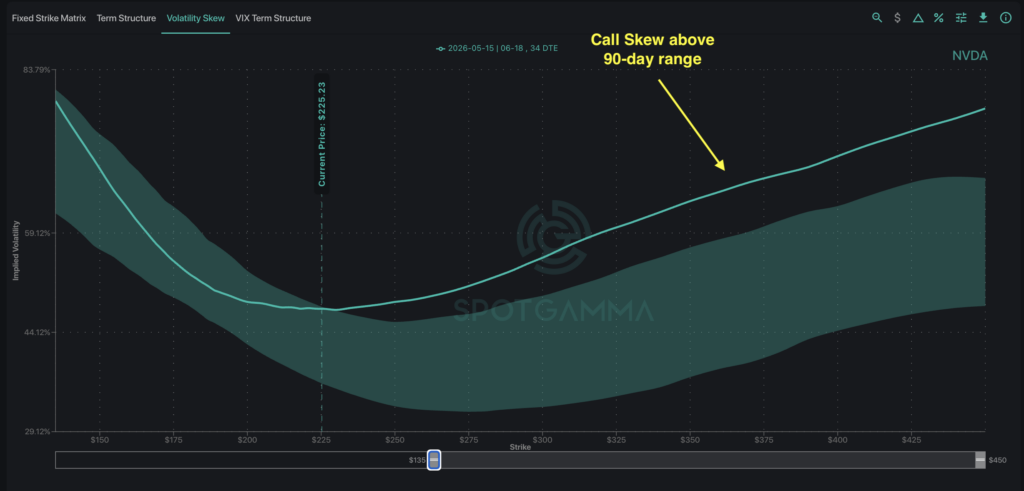
To be clear, NVDA has already rallied over 35% from March lows. With the current scale of upside call positioning, either disappointing earnings or profit-taking at scale could trigger a meaningful reversal. Given NVDA’s market cap and strong correlation with semiconductor and tech names, this carries serious implications for the broader market.
The Tail Hedges: How Traders are Preparing
Despite bullish NVDA positioning into earnings, broader-market defensive positioning is also taking shape. This includes significant downside put structures along with outright put buying across SPY, SMH, and DRAM.
Thursday’s FlowPatrol (May 14) flagged a massive SPY put butterfly trade initiated as the market pushed to all-time highs. Roughly 100k/200k/100k contracts for a 460/530/600 put fly expiring July 17 traded for approximately $0.41, representing nearly $4.7 million in premium paid.
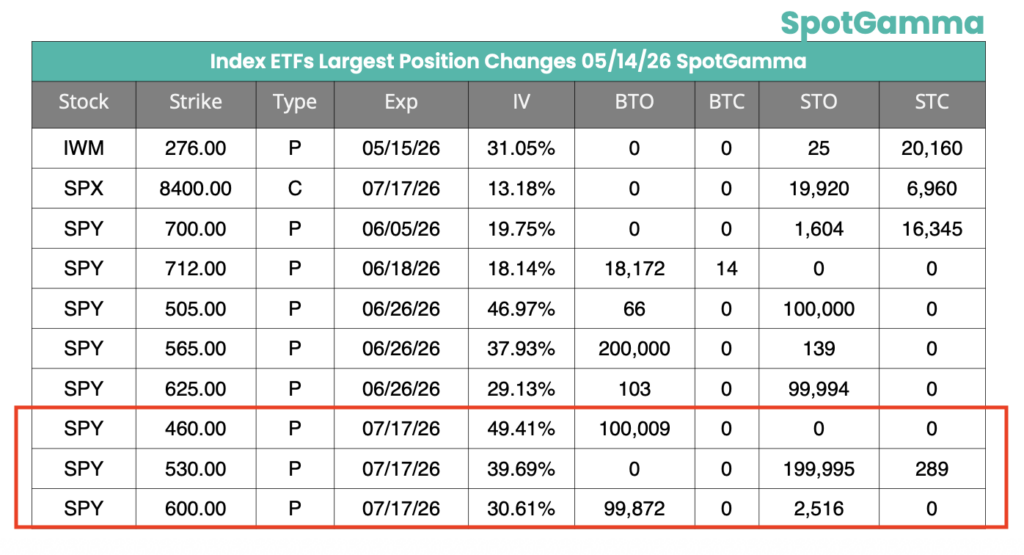
The deep out-of-the-money strikes stand out, suggesting the trade likely functions as a tail hedge. The appeal of this setup is the asymmetric risk-reward profile. As shown in the Options Calculator PnL simulation below, the maximum potential profit is roughly 43x the maximum loss.
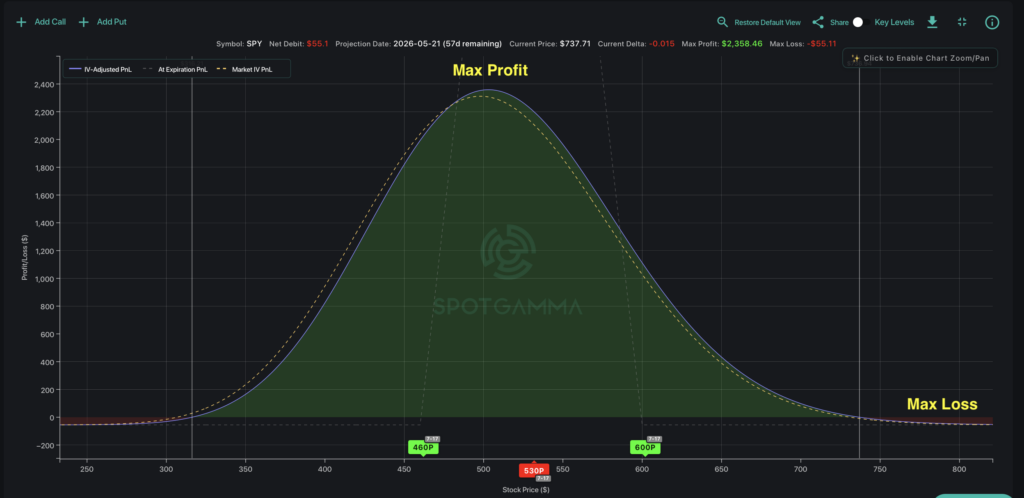
These types of positions seek to capitalize on the nonlinear payoff profile of options — limiting downside risk while maintaining significant convex upside in a sharp selloff scenario.
With far out-of-the-money SPY puts holding somewhat elevated implied volatility, put butterflies and spreads typically offer a more efficient way to express downside hedges compared to outright puts.
The above SPY put fly was not the only trade of note: last week saw 68k contracts of SMH May 22 $500 puts trading for roughly $15 million in premium, alongside 10k DRAM July $40 puts trading for approximately $1.3 million. These trades reflect either hedging activity or fading momentum within the semiconductor and memory complex following the sector’s massive rally.
The common thread across these trades is downside exposure in the semiconductor sector (SMH) and memory names (DRAM), with NVDA itself accounting for over 7% of SPY.
While market participants are by no means bearish on NVDA, there is not-so-insignificant preparation for a downside scenario. Any directional change would almost certainly ripple across the broader market.
With last Friday’s OPEX having cleared significant options positioning, we plan to cautiously observe NVDA earnings this Wednesday as the driver of additional volatility on the horizon.