Last week, the S&P 500 closed its eighth straight weekly gain — the longest streak since 2023. As the rally continues to achieve record highs, underlying options positioning has evolved meaningfully since March.
Most importantly, the market has quietly shed much of the protective hedging that was in place just two months ago. A dense macro calendar ahead therefore leaves the market increasingly susceptible to a short-term volatility event.
NVDA’s positive earnings last week turned into a “kick-the-can-down-the-road” versus a true pressure release valve for index volatility. However, NVDA’s Thursday and Friday selloff reveals how fragility can manifest in unexpected ways.
NVDA Selloff Despite the Earnings Beat?
On Wednesday after the close, NVDA delivered a +6% earnings beat — yet tumbled nearly 5% from highs by Friday. As traders, how do we reconcile this?
First, it’s important to remember that the move did remain within the options-implied range of +/- 5.5% despite the selloff. With extreme call demand into earnings, expectations were sky high: anything less than a massive beat would leave many traders disappointed.
Using the lens of dealer positioning, we can see that NVDA found support atop the 200–220 positive gamma zone highlighted in last Wednesday’s AM Founder’s Note. While earnings did not yield the massive breakout call buyers were anticipating, dealer hedging in this price range limited downside price action.
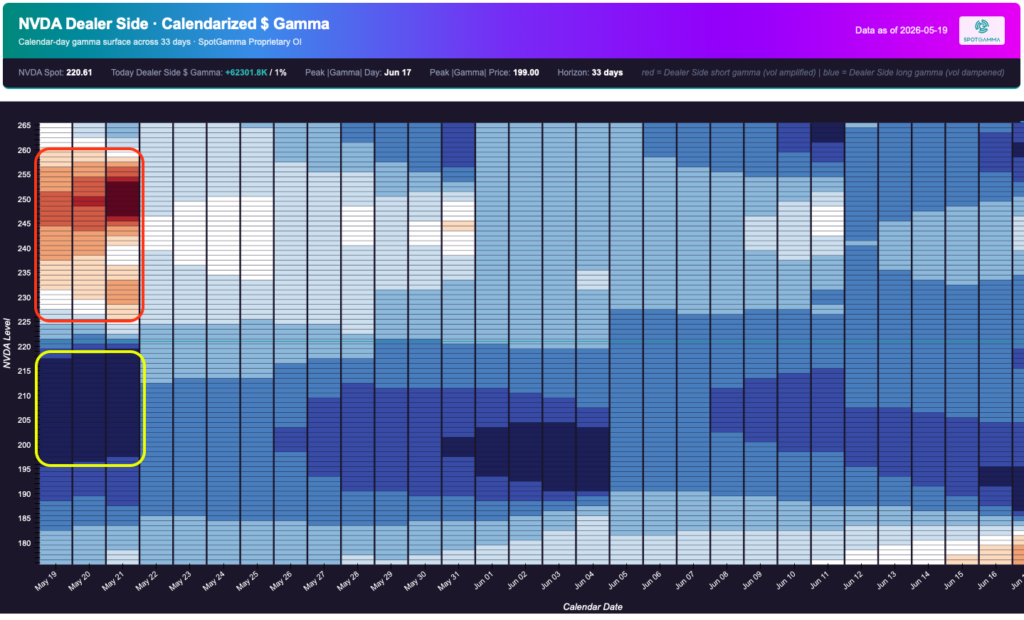
Post-earnings, dealer gamma in NVDA now sits closer to neutral: negative gamma from 235 to 255 has entirely rolled off. This has left the remaining positive gamma now concentrated near the 200 strike as the remaining “shock absorber.”
To summarize, NVDA stood at record highs into Wednesday with extremely bullish options positioning. All eyes were on Wednesday’s report, and the subsequent market reaction — despite the positive quarterly results — led to a selloff. We see many similarities here across the broader market, in cases where soaring expectations are not realized.
Major Indices: Bullish Positioning, Thin Protection
Despite relative weakness from Nvidia last week, the broader market recovered and pushed back toward record highs. Capital appears to have simply rotated into other semiconductor names and broader Mag7 exposure.
Zooming out to the index level, current positioning appears somewhat similar to Nvidia’s pre-earnings setup: the market remains call-heavy, with significantly less hedging activity than just two months ago.
The Risk Reversal chart highlights how SPX positioning has evolved since March. This metric compares select options prices to evaluate how expensive calls are relative to puts.
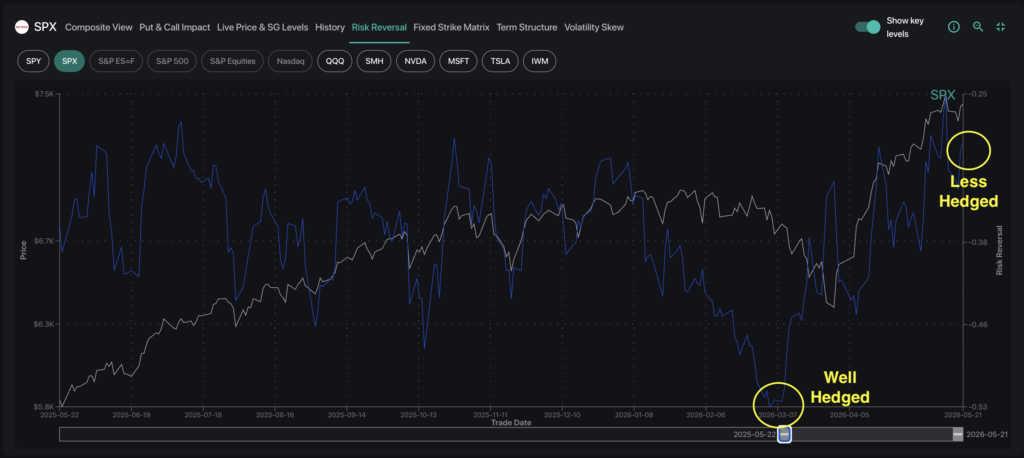
When using the Risk Reversal metric, negative readings suggest stronger demand for downside protection. The positive readings observed last week indicate very strong demand for upside exposure and risk-on appetite.
Breaking the above dynamics down further, S&P 500 call skew sits at the 96th percentile versus the prior year. Put skew rests at just the 4th percentile. In short, traders are leaning even more into this rally than before, through upside call exposure.
In this extreme index position, any profit taking or positioning unwind could trigger accelerated movement.
Catalysts to Watch for the Week Ahead
Looking ahead, SPX Term Structure has returned to contango, where longer-dated implied volatility is priced higher than short-dated implied volatility. Comparing Forward IV against the current term structure, we see four notable dates tied to upcoming macro events:
- May 28: PCE
- June 5: NFP
- June 10: CPI
- June 17: FOMC
Given the sustained risk-on sentiment, the options market may be underpricing the potential for jump risk around these events. Subdued index volatility reflects persistent options selling activity, which has continued to compress risk premium despite market developments.
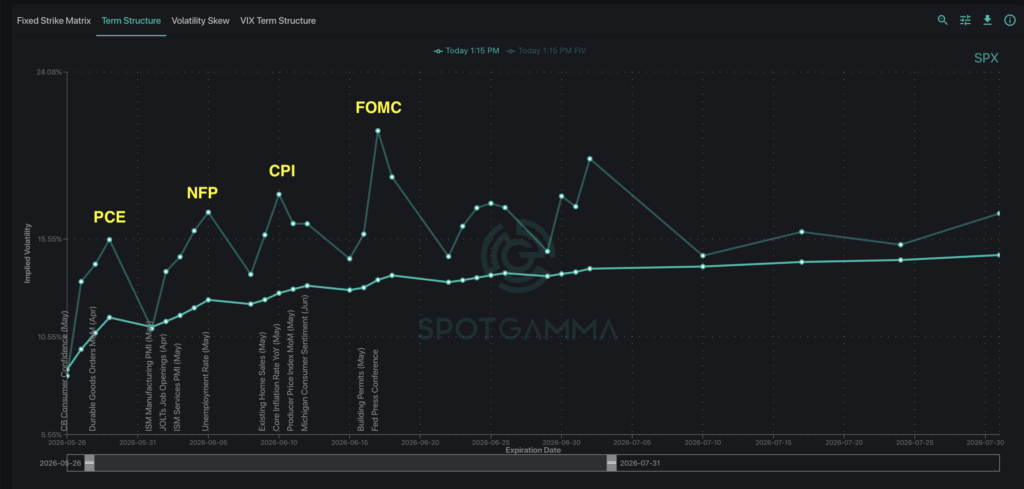
Most notably, June 17 (FOMC) currently shows the largest volatility premium due to increased rate uncertainty. Forward IV hovers near 21% while the broader term structure sits closer to 14%.
This makes sense, given that 30-year yields have crossed 5% — the highest level since 2007. Fixed income markets continue to reflect uncertainty around the path of policy rates and Fed leadership under Kevin Warsh. This may contribute to elevated macro sensitivity across asset markets.
As we move into the upcoming calendar with less protective hedging in place and lighter positive dealer gamma, any meaningful macro surprise could trigger volatility expansion. This type of event would force volatility sellers to cover their positions and amplify any directional movement.