The S&P 500 has posted fresh record highs for the ninth straight week. Tech and semiconductor earnings fueled much of the recent surge, with SNOW climbing 52%, DELL gaining 57%, and MU surging 28% within one week.
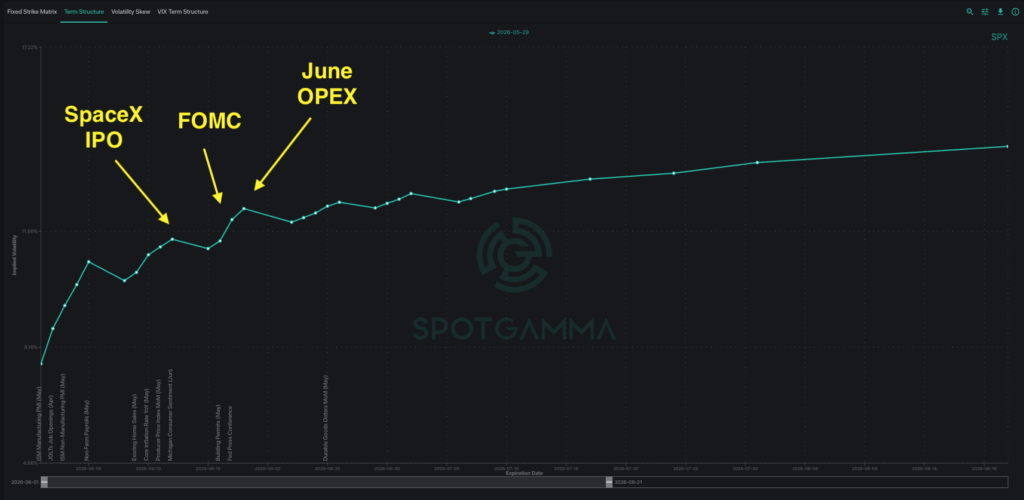
As we move into June, stretched positioning now meets a cluster of major catalysts. Three upcoming events will deliver possibly the greatest test yet to this rally: the SpaceX IPO, monthly OPEX, and FOMC.
SPX remains in a positive gamma environment, which has now helped stabilize markets for the past several weeks. However, the dense patch of significant events poses meaningful risk of a volatility spasm that we are watching attentively through mid-June.
Dispersion Risk Grips Market
One warning sign we consistently track is the COR1M indicator, which has now moved below 8 — alerting us to meaningful dispersion risk. COR1M measures the correlation of implied volatility between individual stocks and S&P 500.
A COR1M reading below 8 suggests aggressive single-stock call positioning, with muted expectations for index movement. This type of setup historically precedes sharp mean-reversion moves in the broader market.
The contrast in volatility expectations between single stocks and the overall index is stark. SPY’s current IV Rank sits at just 13%, while MU is at 94% with DELL’s IV Rank breaching 99%. This suggests traders have aggressively pursued upside exposure through single-stock calls with little expectation for index volatility.
We also observe stretched bullish positioning across many AI stocks, with several stocks displaying a Skew Rank above 90%. Extreme Skew Rank indicates calls are priced relatively high compared to puts of the same expiration.
Significant volatility dispersion has a tendency to mean-revert. Once profit-taking begins, we could see a sharp pullback as extreme call demand unwinds.
The Mid-June Market Event Cluster
The catalyst-dense June calendar is where we are carefully watching for the next volatility spasm. CPI is scheduled for June 10, the SpaceX IPO is expected around June 12, the FOMC meeting follows on June 17, and June OPEX — one of the largest options expirations of the year — occurs on June 18.
Russell recently announced changes that would allow SpaceX to be added to its indexes no sooner than five days after the IPO. Similar adjustments may eventually occur in other major indices. As a result, the $1.8 trillion inclusion could add additional volatility to the market.
Macro risks remain in focus throughout this same timeframe. CPI and the FOMC meeting both have the potential to shift market expectations, while U.S. crude oil inventories are approaching historically low levels. Any oil supply shock would induce a macroeconomic risk factor that extends beyond equities positioning.
The monthly OPEX on June 18 then becomes the final event to consider. Volatility regimes often shift around major expirations as positions unwind or are rolled forward. Depending on headlines from the preceding week, the June expiration could easily become the most significant we have seen in some time.
How Are Traders Hedging Upcoming Event Risk?
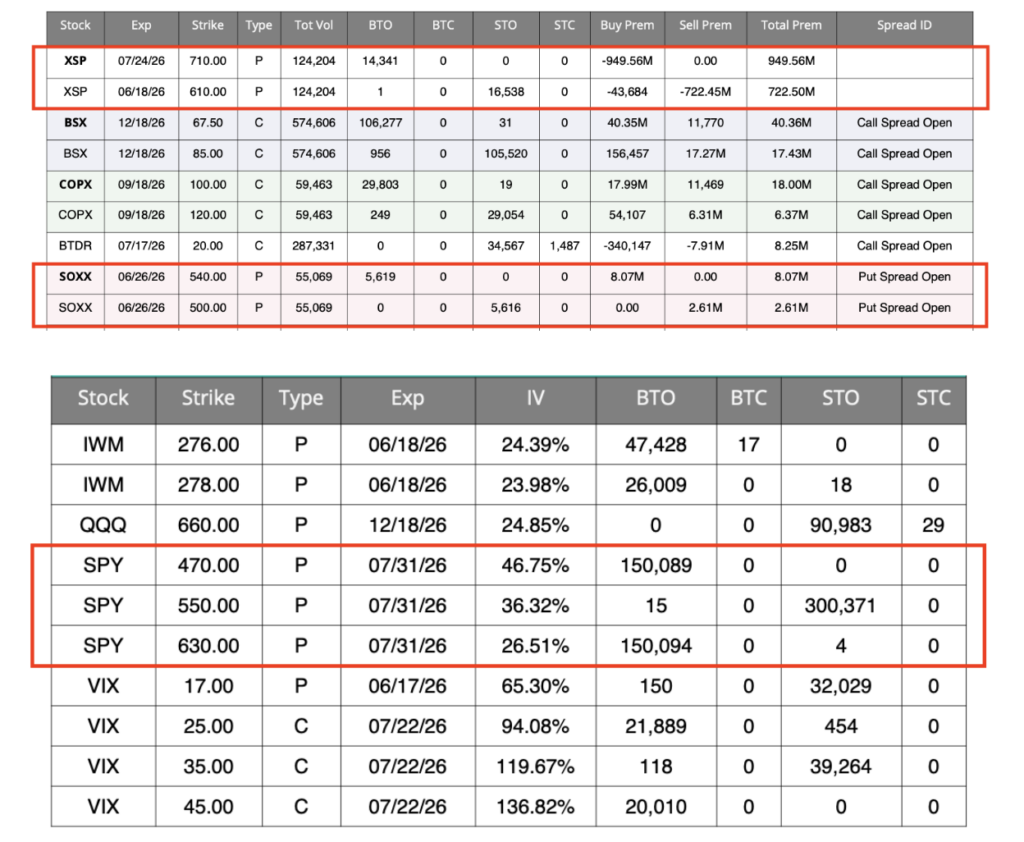
Against the backdrop of significant market events, options market activity suggests some traders have already positioned for increased uncertainty. Notable flow includes:
- IWM puts
- SPY put butterflies
- VIX call butterflies
- XSP put diagonal spreads
- SOXX put spreads
One of the standout trades last week was the ~15k-lot XSP June/July put diagonal spread, due to the size of the premium and potential payout ratio. A put diagonal spread combines the sale of a shorter-dated put with the purchase of a longer-dated put at a different strike. This strategy can benefit from a gradual decline in price and/or an increase in back-month implied volatility relative to front-month volatility.
In simple terms, the trader is buying downside protections for July and funding most of it by selling June puts.
Short leg: June 18 $610P, STO with credit. The front-month and far OTM tail finances the long leg.
Long leg: July 24 $710P, BTO with debit. The back-month and higher strike caps total risk while offering an outsized potential payout.
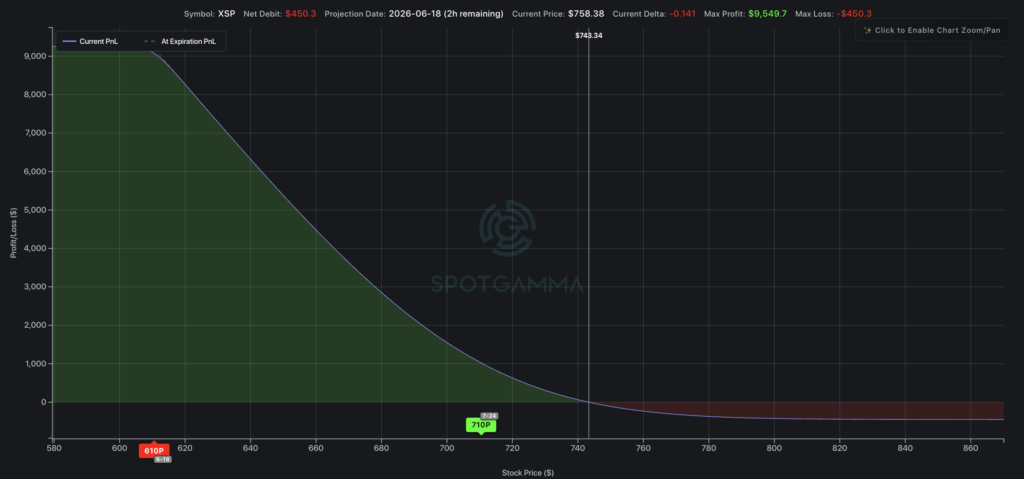
We mapped the trade in SpotGamma’s Options Calculator, adjusting for implied volatility and skew. At June 18 expiry, two scenarios emerge: XSP holds above 610, risk is capped. If XSP breaks below 610, the higher long strike dominates — with a disproportionate payout ratio. Because XSP is 1/10th the size of SPX, translating index levels between the two products is straightforward.
This is one example of how traders are bracing for downside risk over the next month. Our FlowPatrol report details significant or unusual trades, delivering precise insight into how market participants are trading.
