Macro Theme:
Major Resistance: $4,250
Pivot Level: $4,200
Interim Support: $4,200
Range High: $4,300 Call Wall
Range Low: $4,000 Put Wall
‣ We are bullish on the S&P with a close >$4,200
‣ S&P500 may close its performance gap to Nasdaq based on IV and call positions
‣ June FOMC 6/14
‣ June OPEX 6/16
Founder’s Note:
Futures are flat to 4,285, and key SG levels are unchanged to start the week. Major resistance lies overhead at 4,300 – 4,310 (SPY 430), and the heavily watched 6/30 exp JPM collar strikes lies just above there at 4,320. Support below shows at 4,250. If the S&P moves >4,300 we would consider it overbought – unless
Call Wall rolls higher in kind.
In QQQ, first resistance is 355, followed by the 360
Call Wall. Support shows at 350.
As per Friday’s note we are now looking for volatility to contract as:
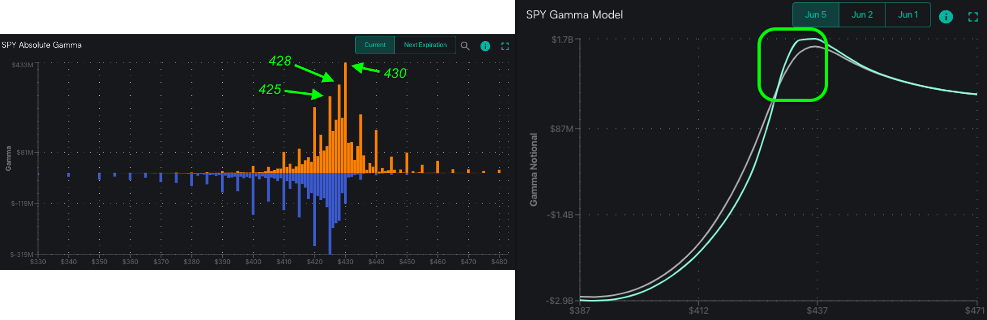
- We are in a heavy positive gamma zone (see chart below, right)
- The massive June OPEX is two weeks out, which implies the market may start to pin to these large gamma strikes in the 4,250-4,320 area (see chart below, left)
- Traders may reduce activity as focus shifts to 6/14 FOMC
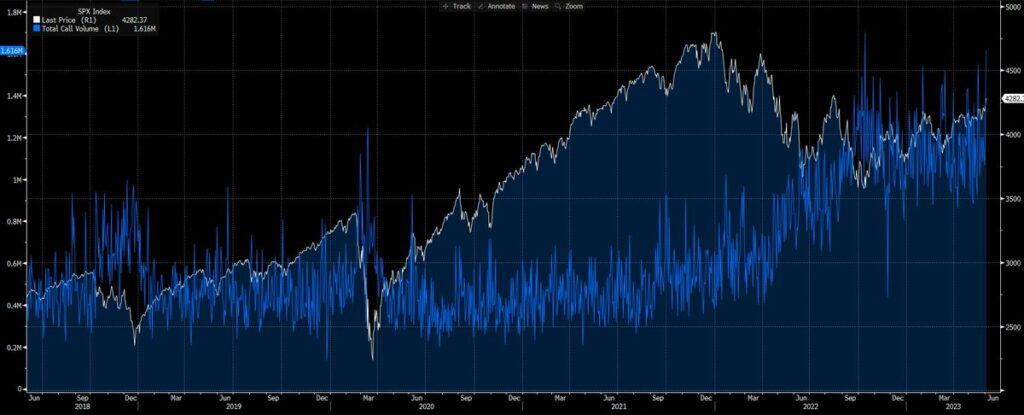
The most remarkable data point from Friday was the near-record SPX
call volumes. The data shows that Friday’s 1.6mm SPX call volume was only second to 10/13/22’s 1.7mm calls.
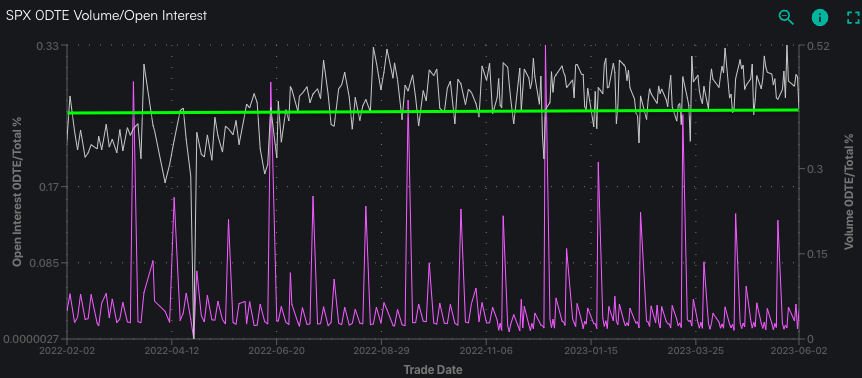
Most people’s first reaction is likely “0TE!”, but we show that 0DTE was only ~40% of Friday’s volume, which obviously implies that this record call activity may have been in large part longer dated options. However, it appears a lot of the calls added were for this weeks expirations.
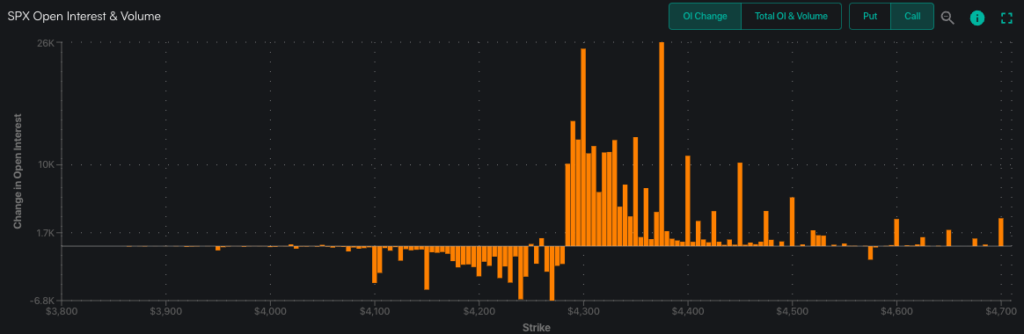
With this we see pretty healthy jumps in call positions at strikes >=4,300 as shown here. We are of the opinion that many traders were looking to catch elevated call IV’s via selling short dated calls >=4,300.
That huge
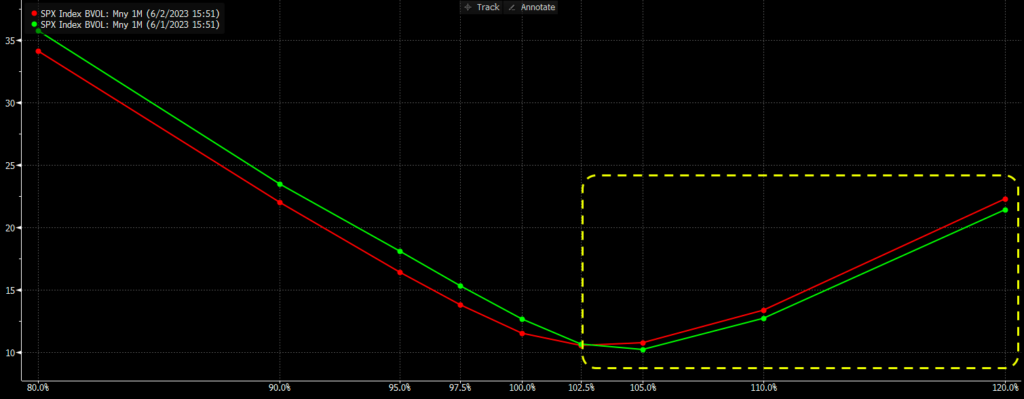
call volume was tied to a very large jump in SPX of ~1.5%, which occurred when the opening 0DTE IV was ~12%. This equates to traders looking for a ~75bps move on the day. Therefore, anyone short cheap calls got steamrolled, which likely resulted in a call over chase to the upside. This, in our view, then brings in momentum long traders. What you see from this is that there was a call skew on Friday – upside strike IV was higher as the market rallied, which implies long call demand. This is shown through Fridays skew reading (red) over Thursday’s (green). This condition has reversed this AM which supports the idea that IV should now come off.
There was also a lot of FinTwit chatter about fixed strike IV being higher on Friday despite the VIX being lower. If you are short on time read a great take on that from @dampedspring here along with a few slides we put together. However, we suggest that you join our Zoom call today with Tom Jarck of the Miami Exchange, who heads up their SPIKES volatility product. Tom has extensive experience leading several bank derivate desks, and so we will be looking to dig in on this topic. Join here at 1PM ET.
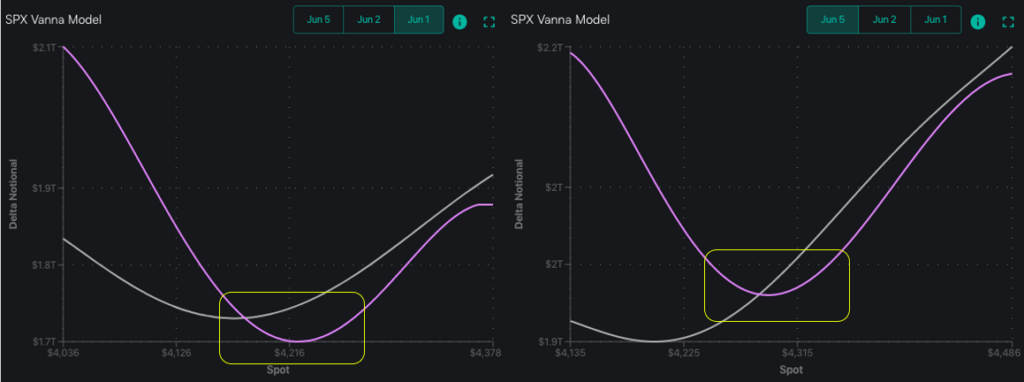
Building on this volatility dynamic, we see a shape to the vanna model which has been quite rare post Jan ’22. On the left is the snapshot from last Thursday, wherein we commented that our model depicted that vanna was a market tailwind up through 4,220. This tailwind was available due to our models picking up an implied volatility premium, and that could serve to reduce dealer long delta exposure. Higher/lower deltas imply dealers need to sell/buy more futures to offset risk. There is no implied volatility premium now.
What we have today is a signal that implied volatility further declining is now, at best, a non-factor, and possibly working as as a headwind. This is driven primarily by the fact that the market is currently embraced by large ATM call positions, which we believe generate upside resistance. This is shown through the higher base delta exposure at higher SPX levels (grey line going higher, right plot).
Per this model, the decay of calls due to a decrease in IV adds to the long delta exposure of the dealer community – this is implied by the fact that the purple IV-adjusted delta figure slides higher as the market moves higher. Note, too, that there is a very small spread between the models (grey base delta & purple IV-adjusted delta) as we move to prices >4,300. This further backs the idea that declining IV no longer offers a market boost.
However, to the downside, with any small move in IV we show long delta exposure shifting materially higher (the spread between the grey & purple lines <=4,350), which could lead to dealers selling.
The net result of all of this is that we have now shifted to neutral on SPX (from bullish on Thursday), looking for market to pin the 4,250 – 4,300 area. This should reduce implied volatility whether you cut it by moneyness, delta, or fixed strike. We’d therefore look for the market to bounce off of large gamma support strikes below, and reject from
large gamma strikes above.
To the upside, as the SPX & SPY
Call Walls are at 4,300/430, we would consider any move over 4,300 as overbought. We do not anticipate the Walls rolling higher in the next few sessions.

| SpotGamma Proprietary Levels | SPX | SPY | NDX | QQQ | RUT | IWM |
|---|---|---|---|---|---|---|
| Reference Price: | $4282 | $427 | $14546 | $354 | $1830 | $182 |
| SpotGamma Implied 1-Day Move: | 0.83% | 0.83% | ||||
| SpotGamma Implied 5-Day Move: | 2.16% | |||||
| SpotGamma Volatility Trigger™: | $4195 | $426 | $12425 | $349 | $1770 | $176 |
| Absolute Gamma Strike: | $4300 | $425 | $15125 | $350 | $1800 | $180 |
| SpotGamma Call Wall: | $4300 | $430 | $15125 | $360 | $1790 | $185 |
| SpotGamma Put Wall: | $4000 | $400 | $14480 | $332 | $1800 | $170 |
| Additional Key Levels | SPX | SPY | NDX | QQQ | RUT | IWM |
|---|---|---|---|---|---|---|
| Zero Gamma Level: | $4162 | $424 | $0 | $351 | $1840 | $182 |
| Gamma Tilt: | 1.62 | 1.148 | 3.386 | 1.075 | 0.933 | 0.955 |
| SpotGamma Gamma Index™: | 2.319 | 0.121 | 0.127 | 0.020 | -0.005 | -0.007 |
| Gamma Notional (MM): | $1.095B | $562.882M | $16.254M | $142.958M | ‑$5.828M | ‑$30.523M |
| 25 Day Risk Reversal: | -0.041 | -0.039 | -0.028 | -0.032 | -0.033 | -0.035 |
| Call Volume: | 827.894K | 2.64M | 9.789K | 634.895K | 32.439K | 758.004K |
| Put Volume: | 1.277M | 3.458M | 8.156K | 1.186M | 42.509K | 1.119M |
| Call Open Interest: | 6.506M | 7.04M | 74.482K | 4.762M | 212.232K | 3.679M |
| Put Open Interest: | 12.631M | 13.738M | 65.925K | 9.849M | 372.551K | 7.673M |
| Key Support & Resistance Strikes |
|---|
| SPX Levels: [4300, 4250, 4200, 4150] |
| SPY Levels: [430, 428, 425, 420] |
| NDX Levels: [15125, 15100, 15000, 13850] |
| QQQ Levels: [360, 355, 350, 340] |
| SPX Combos: [(4475,79.98), (4449,93.12), (4424,85.04), (4402,77.16), (4398,99.51), (4377,95.49), (4364,83.72), (4359,79.58), (4355,85.70), (4351,99.25), (4347,76.55), (4338,82.07), (4329,88.06), (4325,98.76), (4321,98.59), (4308,90.90), (4304,93.55), (4299,99.94), (4295,88.19), (4291,77.53), (4282,77.21), (4278,88.65), (4274,95.77), (4270,78.20), (4265,80.08), (4248,97.58), (4227,87.39), (4201,88.48), (4098,85.90)] |
| SPY Combos: [436.05, 430.92, 445.89, 441.19] |
| NDX Combos: [15129, 15099, 14765, 13848] |
| QQQ Combos: [340.15, 371.36, 371.01, 362.85] |
SPXSPYNDXQQQRUTIWM
SPX Gamma Model
Jun 5$3,448$3,898$4,348$5,139Strike-$1.7B-$865M-$65M$1.4BGamma NotionalPut Wall: 4000Call Wall: 4300Abs Gamma: 4300Vol Trigger: 4195Last Price: 4282
©2023 TenTen Capital LLC DBA SpotGamma
All TenTen Capital LLC DBA SpotGamma materials, information, and presentations are for educational purposes only and should not be considered specific investment advice nor recommendations. Futures, foreign currency and options trading contains substantial risk and is not for every investor. An investor could potentially lose all or more than the initial investment. Risk capital is money that can be lost without jeopardizing one’s financial security or lifestyle. Only risk capital should be used for trading and only those with sufficient risk capital should consider trading. Past performance is not necessarily indicative of future results. VIEW FULL RISK DISCLOSURE https://spotgamma.com/model-faq/disclaimer/