• Skip to main content
  • Skip to primary sidebar

SpotGamma™

S&P 500 Stock Market Gamma Trading Levels Based on Options Open Interest

  • About
  • Pricing
  • Academy
  • Resources
    • Tool Demos
    • Case Studies
    • Blog
    • Support Center
    • Free Daily Report
    • Free Trading Tools
      • Options Profit Calculator
      • SPX Gamma Exposure
      • Implied Earnings Moves
      • Volatility Ranking
    • Free Training
    • Report Card
  • Login

Apr 28 2026

How to Trade the Vanna Rally: Profiting When Volatility Drops

Quick Answer: To trade a Vanna rally, look for moments when the VIX is declining from an elevated level while the market is in a “Short Vanna” regime. As IV drops, dealers must buy futures to offset their shrinking delta, creating mechanical buying pressure that lifts the S&P 500 higher regardless of fundamental news.

Some of the most powerful rallies in the S&P 500 are not driven by earnings, Fed policy, or geopolitical headlines. They are driven by the mechanical requirement of options dealers to buy futures as volatility declines. This is the Vanna Rally.

Here is your step-by-step guide to identifying and trading this setup using Vanna and Charm dynamics.

Step 1: Identify a “Short Vanna” Market

A Short Vanna regime occurs when market makers have sold a significant amount of options with high Vanna exposure. This is common after periods of elevated hedging demand (like a fear spike or major event). Check the SpotGamma Key Levels dashboard—if the market is below the “Vol Trigger,” odds are we’re in Short Vanna territory.

Step 2: Watch for the VIX to Roll Over

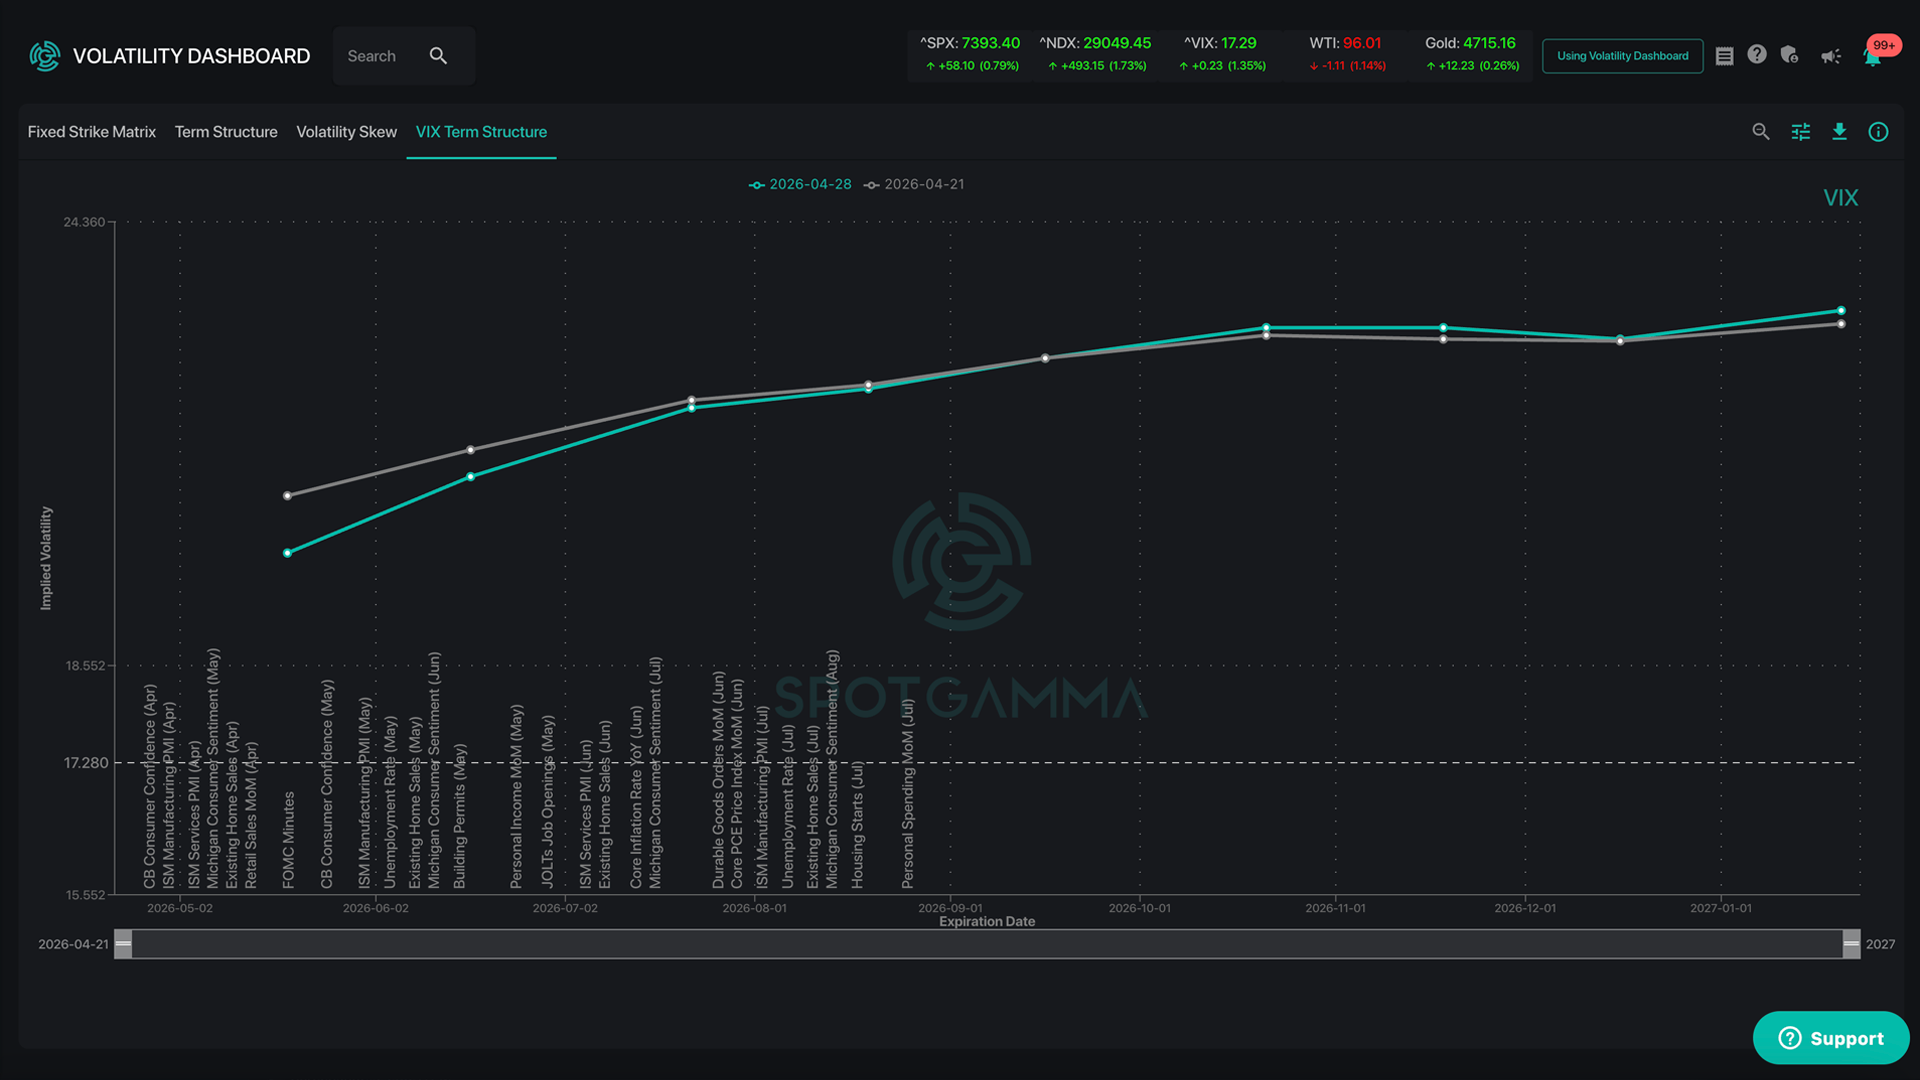
The Vanna rally ignites when the VIX starts to decline. This doesn’t require a catalyst—it can simply be the natural decay of fear premium after an event passes. As IV falls:

  • Dealer delta exposure shrinks.
  • To remain neutral, dealers must buy futures.
  • This buying pushes price higher, which further reduces IV, creating a self-reinforcing loop.

Step 3: Trade With the Flow (Not Against It)

In a Vanna rally, shorting the market is fighting the mechanical flow. Traders should look to:

  • Go Long SPX/SPY: Ride the dealer buying until Vanna exposure is neutralized.
  • Sell Put Spreads: Capture the IV collapse while benefiting from directional drift higher.
  • Avoid Buying Puts: You will be fighting both Vanna and the declining IV (Vega drag).

Step 4: Know When It Ends

The Vanna rally exhausts itself when:

  • The VIX reaches its historical floor (typically 12-14).
  • The market moves above the “Vol Trigger” level, flipping dealers back to a neutral/long Vanna position.
  • New hedging demand enters the market (new fear event, FOMC, etc.).

Summary Checklist

  1. Confirm Short Vanna (below Vol Trigger).
  2. Wait for VIX to decline from elevated levels.
  3. Trade long or sell put spreads—don’t fight the flow.
  4. Exit as VIX approaches historical lows or dealers flip to Long Vanna.

Want to track the Vanna regime in real-time? Join SpotGamma Alpha and master the volatility flows.

Share This Article

  • Share
  • Twitter
  • LinkedIn
  • Reddit
  • Facebook

Written by SpotGamma · Categorized: Market Analysis

Don’t have an account with SpotGamma?

Choose the plan you want today to view unique support and resistance levels, access Founder’s Notes and expert commentary, daily trading ranges, and entrance into our private Discord.


Primary Sidebar

Related Resources

  • Another SpaceX Unlock, and Why $150 Still Caps the Stock

    Another SpaceX Unlock, and Why $150 Still Caps the Stock

    August 20, 2026
  • Options Exchange Monitor — Week of August 15, 2026 (36 SEC notices, 2 CFTC, 0 EDGAR)

    Options Exchange Monitor — Week of August 15, 2026 (36 SEC notices, 2 CFTC, 0 EDGAR)

    August 17, 2026
  • GEX Levels for SPY, QQQ, ES and NQ: Using Index Gamma in Any Product

    GEX Levels for SPY, QQQ, ES and NQ: Using Index Gamma in Any Product

    August 17, 2026
  • How to Trade GEX Levels: A Practical Guide to Gamma-Based Trading

    How to Trade GEX Levels: A Practical Guide to Gamma-Based Trading

    August 17, 2026
  • Free GEX Levels, Charts, and Data: What’s Available and What It’s Actually Worth

    Free GEX Levels, Charts, and Data: What’s Available and What It’s Actually Worth

    August 17, 2026
  • youtube
  • x
  • Privacy Policy
  • Disclaimer
  • Terms & Conditions
  • Support Center
  • Media
  • Contact Us

©2026 TenTen Capital LLC DBA SpotGamma

All SpotGamma materials, information, and presentations are for educational purposes only and should not be considered specific investment advice nor recommendations. Futures, foreign currency and options trading contains substantial risk and is not for every investor. An investor could potentially lose all or more than the initial investment. Risk capital is money that can be lost without jeopardizing one's financial security or lifestyle. Only risk capital should be used for trading and only those with sufficient risk capital should consider trading. Past performance is not necessarily indicative of future results. Testimonials appearing on this website may not be representative of other clients or customers and is not a guarantee of future performance or success.

View Full Risk Disclosure