Get a FREE 5 Day Trial of SpotGamma! Click here.
Daily Note:
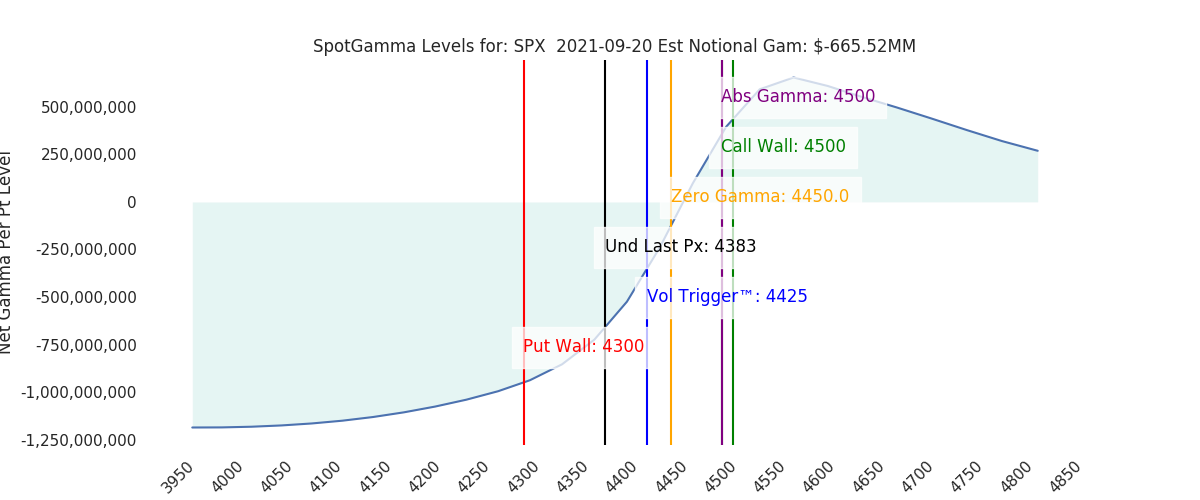
Futures are down sharply to 4370, and both gamma and vanna are setup to push volatility today. As we start with a sharply negative gamma position, the SG Implied S&P500 max move for today is a large 2%. This negative gamma position doesn’t flip positive unless markets recover the 4425 area. For today we look to 4415 as resistance, with support at 4360 and 4310.
This scenario has been in our forecast for some time. Markets lost gamma stability due to last weeks expirations, and they’ve also lost that critical reflexive volatility selling function due to the FOMC on 9/22. This volatility selling function is “buyback fuel” for markets, and it’s likely up to the Fed to re-invoke that function. It should be a wild day & week.
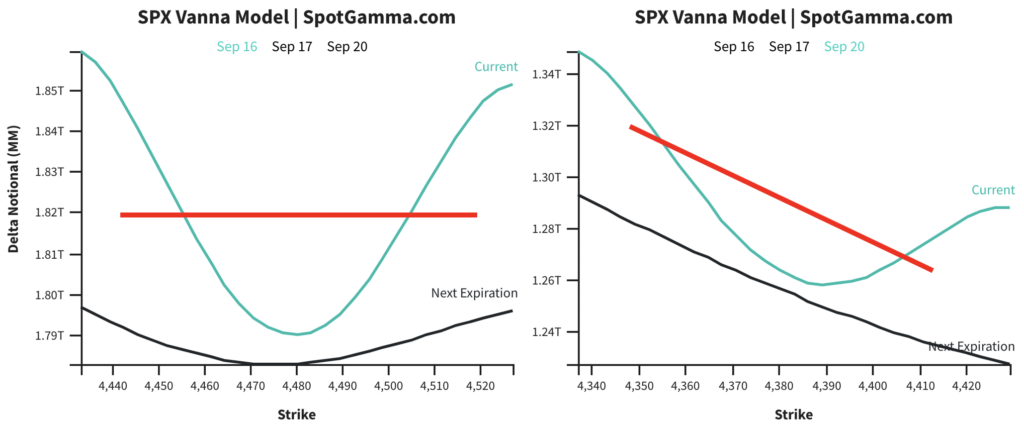
The vanna model depicts the state of markets. You can see on the left the snapshot is very balanced which suggest dealers had a fairly neutral position on 9/16. On the right we have this mornings reading which shows a very sharp right skew. This skew implies that dealers have a lot of short hedges to fire off if markets decline, and a lot to buy back if markets rally. In other words: this market is wound up.
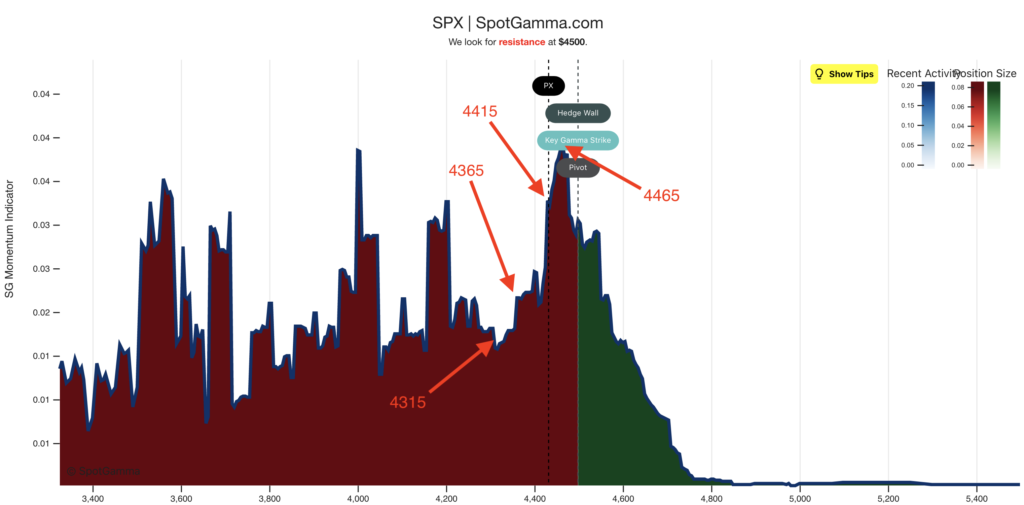
On days like these we turn to our EquityHub model as a map. This model lays out where there are major inflection points in gamma position, which we believe can be key support and resistance lines. We believe that when the gamma position changes it may invoke a “state change” in hedging, which we’d watch for at 4365 and 4315.
The key for today will be in watching implied volatility levels (ie VIX, currently 25). A higher VIX likely means lower markets. If the VIX trend breaks lower that implies a rally.
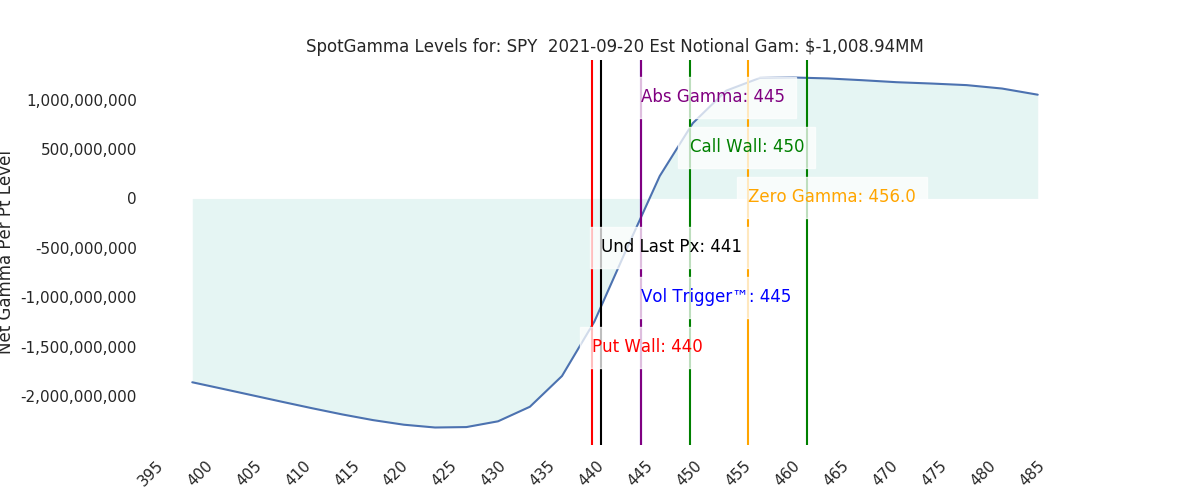
All strikes below 4400SPX/440SPY are dominated by put gamma, which are very sensitive to implied volatility. If the VIX breaks higher it indicates that puts are in demand which could lead to dealers needing to short more futures. VIX moving lower may be a signal that traders are selling puts, in which case dealers may be able to buy back their short hedges.
We will be doing our best to be in the discord chat today, sharing out latest thoughts and data from the HIRO real time options flow.
Model Overview:
We look for high volatility due to negative gamma into 9/22 FOMC.
| SpotGamma Proprietary Levels | Latest Data | Previous | SPY | NDX | QQQ |
|---|---|---|---|---|---|
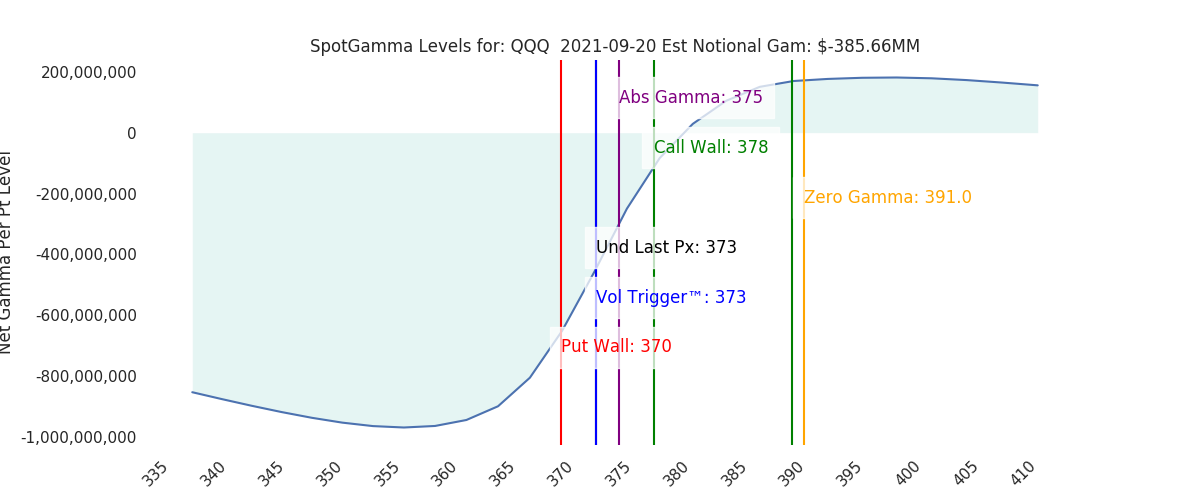
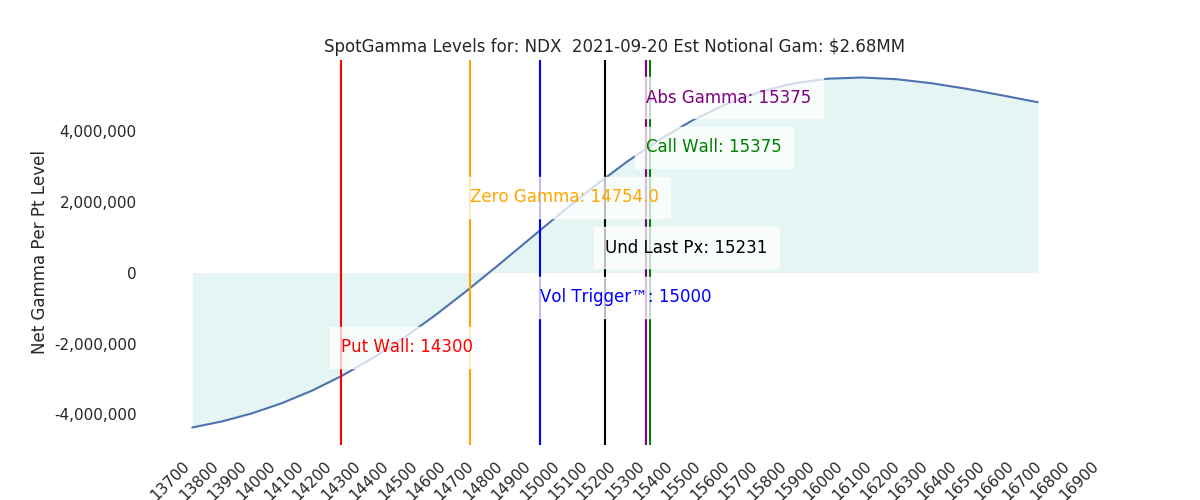
| Ref Price: | 4383 | 4465 | 441 | 15231 | 373 |
| SpotGamma Imp. 1 Day Move: | 2.0%, | 88.0 pts | Range: 4295.0 | 4471.0 | ||
| SpotGamma Imp. 5 Day Move: | 2.6% | 4383 (Monday Ref Px) | Range: 4269.0 | 4497.0 | ||
| SpotGamma Gamma Index™: | -0.60 | 0.32 | -0.25 | 0.03 | -0.08 |
| Volatility Trigger™: | 4425 | 4460 | 445 | 15000 | 373 |
| SpotGamma Absolute Gamma Strike: | 4500 | 4475 | 445 | 15375 | 375 |
| Gamma Notional(MM): | $-666 | $-310 | $-1,009 | $3 | $-386 |
| Additional Key Levels | Latest Data | Previous | SPY | NDX | QQQ |
|---|---|---|---|---|---|
| Zero Gamma Level: | 4450 | 4500 | 0 | 0 | 0 |
| Put Wall Support: | 4300 | 4450 | 440 | 14300 | 370 |
| Call Wall Strike: | 4500 | 4475 | 450 | 15375 | 378 |
| CP Gam Tilt: | 0.83 | 0.9 | 0.74 | 1.38 | 0.76 |
| Delta Neutral Px: | 4361 | ||||
| Net Delta(MM): | $1,169,525 | $1,698,902 | $174,874 | $31,774 | $85,099 |
| 25D Risk Reversal | -0.11 | -0.07 | -0.08 | -0.09 | -0.09 |
| Top Absolute Gamma Strikes: |
|---|
| SPX: [4525, 4500, 4450, 4400] |
| SPY: [450, 445, 443, 440] |
| QQQ: [380, 378, 375, 370] |
| NDX:[16000, 15500, 15375, 15000] |
| SPX Combo: [4440.0, 4370.0, 4488.0, 4344.0, 4462.0] |
| SPY Combo: [448.02, 440.96, 452.88, 438.31, 450.23] |
| NDX Combo: [15365.0, 15046.0, 15243.0, 14833.0, 15532.0] |
| ©TenTen Capital LLC d.b.a. SpotGamma Please leave us a review: Click Here |
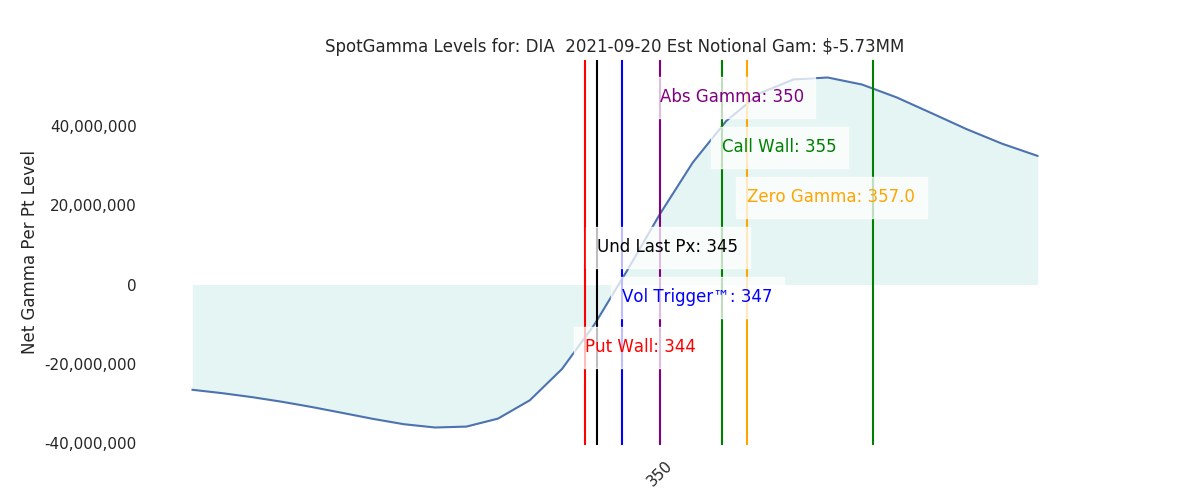
| See the FAQ for more information on reading the SpotGamma graph. |
| SpotGamma provides this information for research purposes only. It is not investment advice. SpotGamma is not qualified to provide investment advice, nor does it guarantee the accuracy of the information provided. This email is intended solely for subscribers, please do not distribute the information without the express written consent of SpotGamma.com. |