Join the live Member Q&A today at 1PM ET (here).
Macro Theme: |
Key Levels: |
| >Major resistance: $3,900 (SPY Call Wall) >Major support: $3,800 (SPY Put Wall) >Critical Dates: 1/12 CPI, 1/20 Jan OPEX >Major risk lies on a break of 3800, as dealers may flip to negative gamma hedging | Ref Price: 3852 SG Implied 1-Day Move: 1.28% SG Implied 5-Day Move: 2.89% Volatility Trigger: 3845 Absolute Gamma Strike: 4000 Call Wall: 4000 Put Wall: 3800 |
Daily Note:
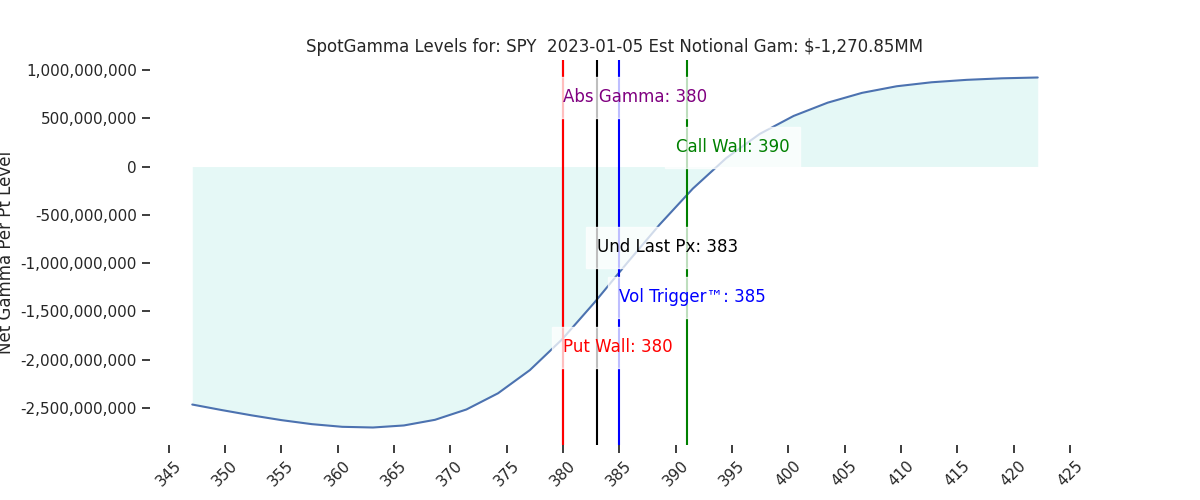
Futures are up slightly to 3878. This morning the market contends with 8:30AM ET jobless claims, followed by Nonfarms tomorrow AM. Key SG levels remain unchanged, with major resistance holding at 390 SPY (3910 SPX). The pivot area holds in the 3945-3955 area (Vol Trigger/SPX 3950 & SPY 395 large gamma strikes), and large support persists at 3800.
Yesterdays SPX map we laid (here) remains in play for today, wherein we are stuck in the 3800 handle(s) neutral zone and need a spark. There should be a nice setup for a tradable swing once we tip out of this 38xx zone, until then we are lying in wait.
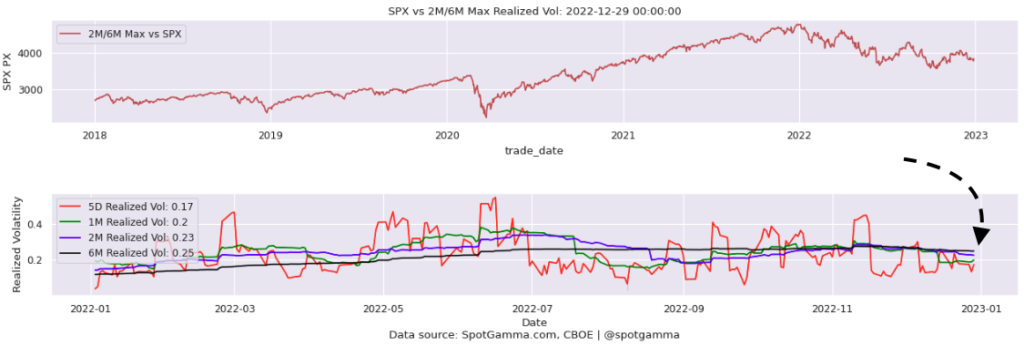
From a similar “neutral zone” perspective, IV is stuck. 1 month realized volatility (green line, lower chart) in the SPX is ~20, a level which has been the low for the past year. There is little reason to think that realized volatility would come down anytime soon, and this should therefore set a baseline for implied volatility.
Accordingly, you can see that ~20 level of volatility is more or less what is being priced in the future, as shown in the SPX term structure below. This implies that there isn’t much IV premium to sell.
While there are jobless claims numbers today, options traders have more attention on tomorrows Nonfarms and indicated by the IV premium (or backwardation). Following Nonfarms, focus will then shift immediately to Tuesdays CPI (1/12).
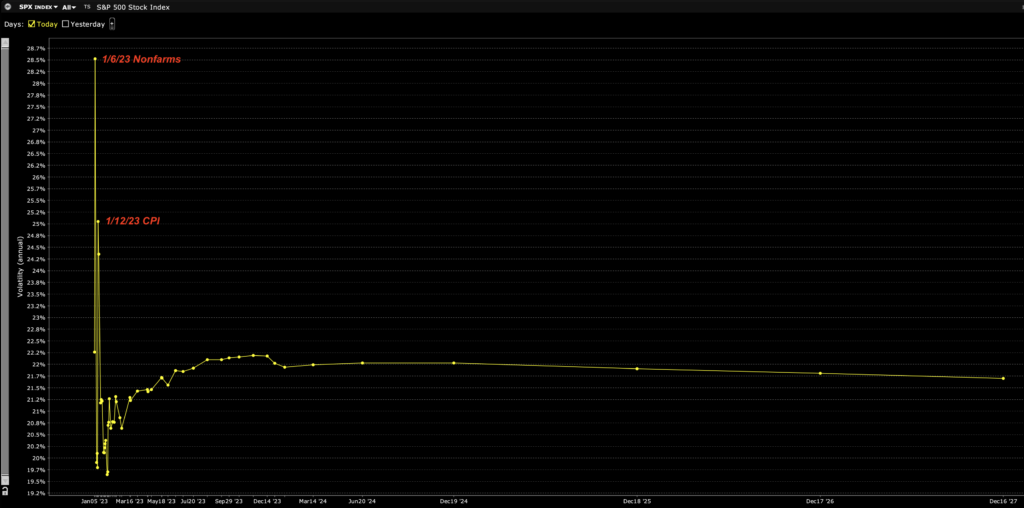
It seems that “in line” data points serve to just shift attention to the next macro figure as it may offer a glimpse into Fed policy. However, as you can see above, the rest of the term structure remains in a sleepy contango with IV’s that basically reflect that 20 realized volatility (i.e. there is no fear premium). We think this lack of premium simply reflects lack of long term (anything past 2-3 weeks) options demand, and trade is focused on the 0DTE gyrations. As we’ve noted ad nauseam, there is nothing that resembles fear in this market, but at the same time there isn’t upside demand, either.
We are currently a bit too far out in time from Jan OPEX for any material charm effect, and IV isn’t impressive enough here to offer much in the way of vanna. Barring any aberrant jobs data print, we continue to think downside price action is going to be met with mean reversion off of 3800 as traders seek to play 0DTE elevated IV’s. If we can break out over 3900, the lack of overhead call positioning could draw some new flows, and serve to pull forward Jan OPEX put-decay (i.e. Jan puts decline in value quickly as the move OTM).
| SpotGamma Proprietary SPX Levels | Latest Data | SPX Previous | SPY | NDX | QQQ |
|---|---|---|---|---|---|
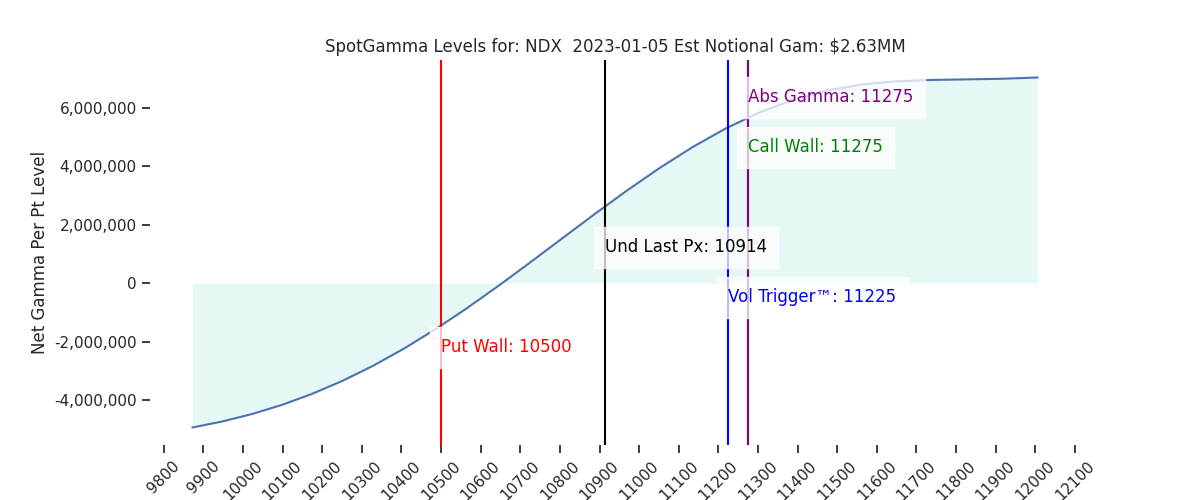
| Ref Price: | 3852 | 3835 | 383 | 10914 | 265 |
| SG Implied 1-Day Move:: | 1.28%, | (±pts): 49.0 | VIX 1 Day Impl. Move:1.39% | ||
| SG Implied 5-Day Move: | 2.89% | 3839 (Monday Ref Price) | Range: 3729.0 | 3951.0 | ||
| SpotGamma Gamma Index™: | -0.43 | -0.94 | -0.24 | 0.01 | -0.07 |
| Volatility Trigger™: | 3845 | 3840 | 385 | 11225 | 265 |
| SpotGamma Absolute Gamma Strike: | 4000 | 4000 | 380 | 11275 | 265 |
| Gamma Notional(MM): | -312.0 | -416.0 | -1271.0 | 3.0 | -490.0 |
| Put Wall: | 3800 | 3700 | 380 | 10500 | 260 |
| Call Wall : | 4000 | 4000 | 390 | 11275 | 271 |
| Additional Key Levels | Latest Data | Previous | SPY | NDX | QQQ |
|---|---|---|---|---|---|
| Zero Gamma Level: | 3913 | 3896 | 392.0 | 10669.0 | 300 |
| CP Gam Tilt: | 0.87 | 0.77 | 0.63 | 1.25 | 0.69 |
| Delta Neutral Px: | 3908 | ||||
| Net Delta(MM): | $1,427,311 | $1,343,983 | $145,499 | $38,591 | $78,907 |
| 25D Risk Reversal | -0.04 | -0.05 | -0.03 | -0.04 | -0.04 |
| Call Volume | 531,139 | 488,698 | 1,913,553 | 6,438 | 703,571 |
| Put Volume | 912,265 | 892,814 | 3,318,661 | 6,682 | 1,402,149 |
| Call Open Interest | 5,526,643 | 5,248,810 | 6,298,321 | 61,524 | 4,639,151 |
| Put Open Interest | 9,833,261 | 9,673,237 | 11,294,128 | 52,538 | 5,896,673 |
| Key Support & Resistance Strikes: |
|---|
| SPX: [4000, 3900, 3850, 3800] |
| SPY: [390, 385, 382, 380] |
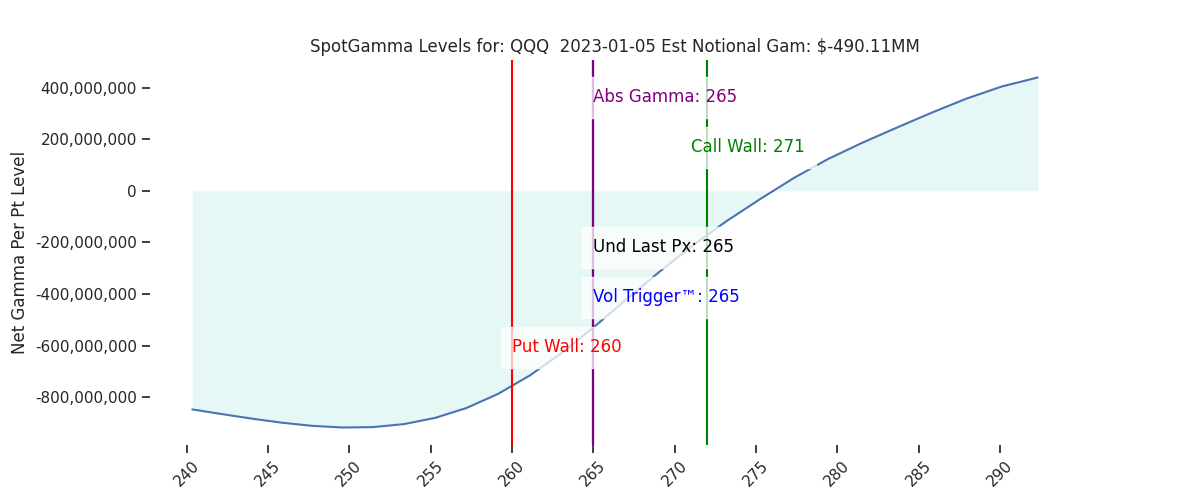
| QQQ: [280, 270, 265, 260] |
| NDX:[12000, 11500, 11275, 11000] |
| SPX Combo (strike, %ile): [(3999.0, 87.4), (3926.0, 83.36), (3899.0, 81.29), (3826.0, 77.76), (3814.0, 89.76), (3799.0, 95.92), (3776.0, 82.72), (3764.0, 78.54), (3749.0, 92.53), (3726.0, 81.36), (3714.0, 79.62), (3699.0, 95.3), (3676.0, 78.21)] |
| SPY Combo: [378.39, 368.41, 373.4, 379.92, 398.34] |
| NDX Combo: [11275.0, 10675.0, 10882.0, 10478.0] |

| ©TenTen Capital LLC d.b.a. SpotGamma Please leave us a review: Click Here |
| See the FAQ for more information on reading the SpotGamma graph. |
| SpotGamma provides this information for research purposes only. It is not investment advice. SpotGamma is not qualified to provide investment advice, nor does it guarantee the accuracy of the information provided. This email is intended solely for subscribers, please do not distribute the information without the express written consent of SpotGamma.com. |