Macro Theme: |
Key Levels: |
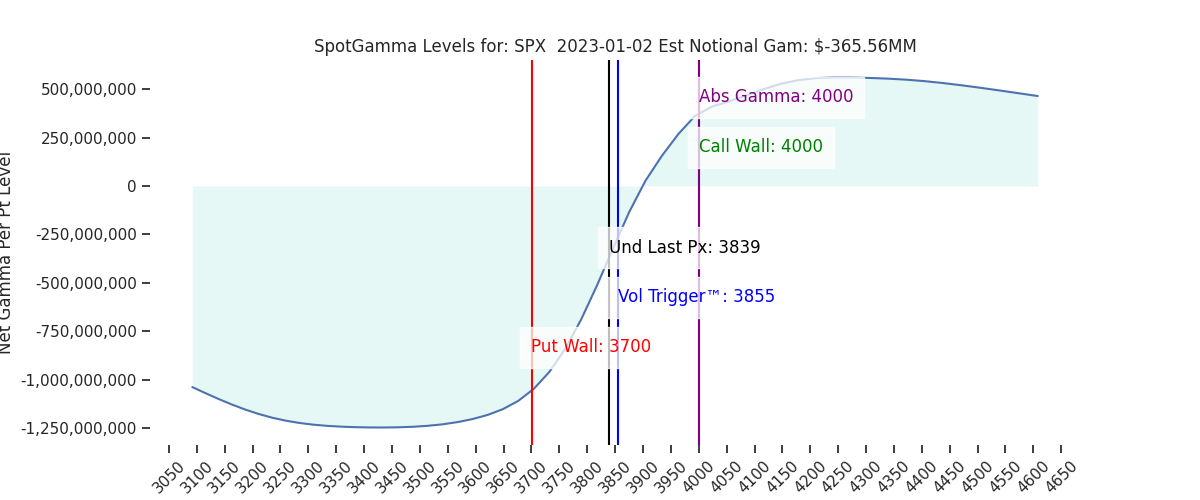
| >Major resistance: $3,900 (SPY Call Wall) >Major support: $3,765 (SPY Put Wall) >Critical Dates: 12/30 OPEX – Large JPM Collar Strike: $3,835 >Major risk lies on a break of 3765, as dealers may flip to negative gamma hedging | Ref Price: 3839 SG Implied 1-Day Move: 1.28% SG Implied 5-Day Move: 2.89% Volatility Trigger: 3855 Absolute Gamma Strike: 4000 Call Wall: 4000 Put Wall: 3700 |
Daily Note:
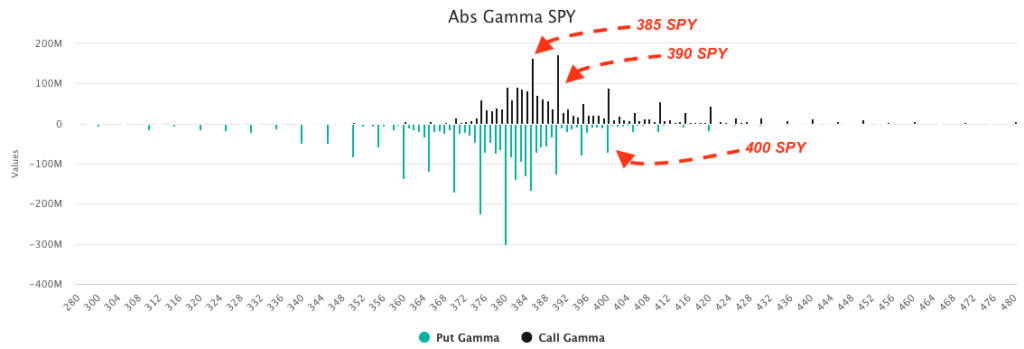
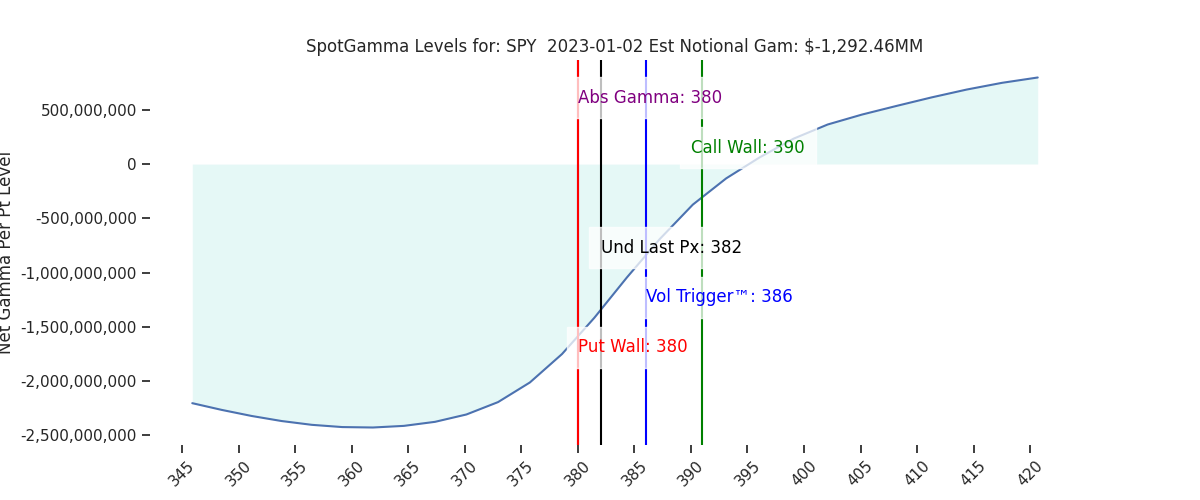
Futures are up 20 handles, to 3880. With Fridays expiration, the S&P should move away from the 3835 area pin that dominated into year end. 3900 SPX to 3913 (SPY 390 Call Wall) is first resistance overhead, with no second resistance line until 4000 (SPX Call Wall). Support shows at 3850, then 3800.
Our general view for today is that there is large support in the 3850 area, and fairly solid resistance at 390 SPY. A close above 390 SPY implies a test of 400 SPY/4000 SPX, as above 390/3900 there is little in the way of positioning until 400/4000 SPX.
Over the last week, we outlined several reasons for a sharp rally in January (see Fridays AM note, also “Correlation” here & “VIX up, market up” here). Our thesis revolves around the following:
- There is a large, put-heavy (in SPY/SPX/QQQ) 1/20 expiration that can provide rally fuel. The expiration is currently more put/call neutral for single stocks as a whole.
- Demand for downside new protection is very low, suggesting little fear in markets.
- Correlation was breaking down as the market was going down as there was weakness in some major stocks (ex: AAPL, AMZN, TSLA), but corresponding all time highs in others (ex: MCD, KO, MRK). This implies stock flows are rotating across names, not out of equities as a whole. Note the top constituents in the S&P500 plotted below (+ TSLA), wherein the megacap tech is all drastically underperforming (and becoming a smaller part of the SPX) vs BRK/B & UNH.
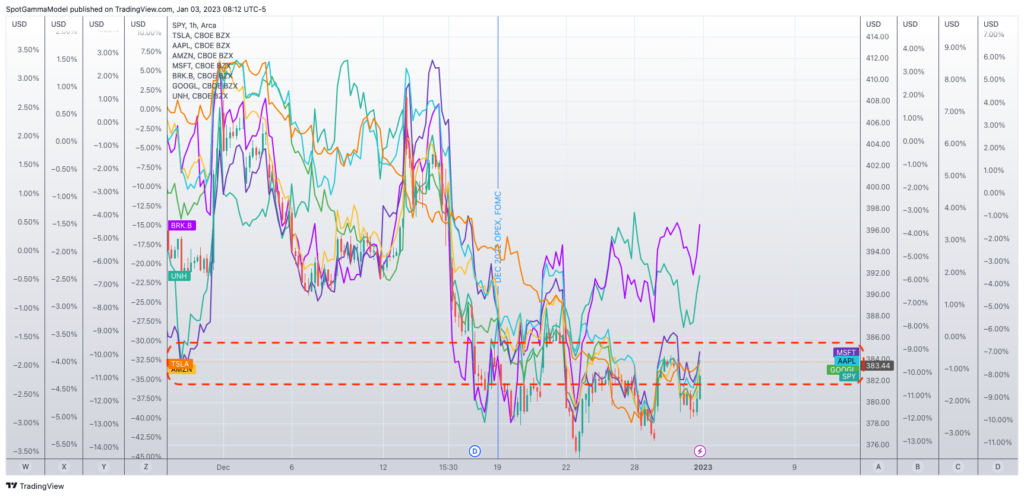
The concern for traders here may be in missing the “right tail” more than the left. This is a theme that we think not only exists today, but will be a dominant theme for 2023*. As a result there will likely be more persistent pockets of long call demand, akin to what we saw going into Dec CPI/FOMC.
As large cap tech is sold off, traders are buying other sectors. This turns downside into a “grind” for the S&P, which benefits from diversification. However, in a chase higher all stocks will likely go up, which pushes correlation to one (again see this note), and could result in more “market up/VIX up” moves.
Adjusting to the “here & now”, price action is about OPEX driven feedback loops.
A move higher to kick of the year may start a chase, and it can use some of that put-heavy positioning as fuel. If we rally now, that will create an air pocket underneath that we will likely have to contend with around Jan OPEX. We assign edge to this scenario, with 4000-4060 SPX the overhead target area.
Conversely, if the market is weak to start it can drive put values higher which serves to add dealer shorting. This threat occurs on a break of 3800. The issue with downside here is that there as been little to no volatility pop on weak markets – not only in index flow but also single stocks. Note the “AAPL VIX” plotted below, which is somewhat elevated, but recall the stock is at ~2 year lows! Through this lens its hard to believe that downside hedging demand suddenly spikes simply because of the new calendar year started – we think there would have to be some major development (geopolitical, credit event, etc).
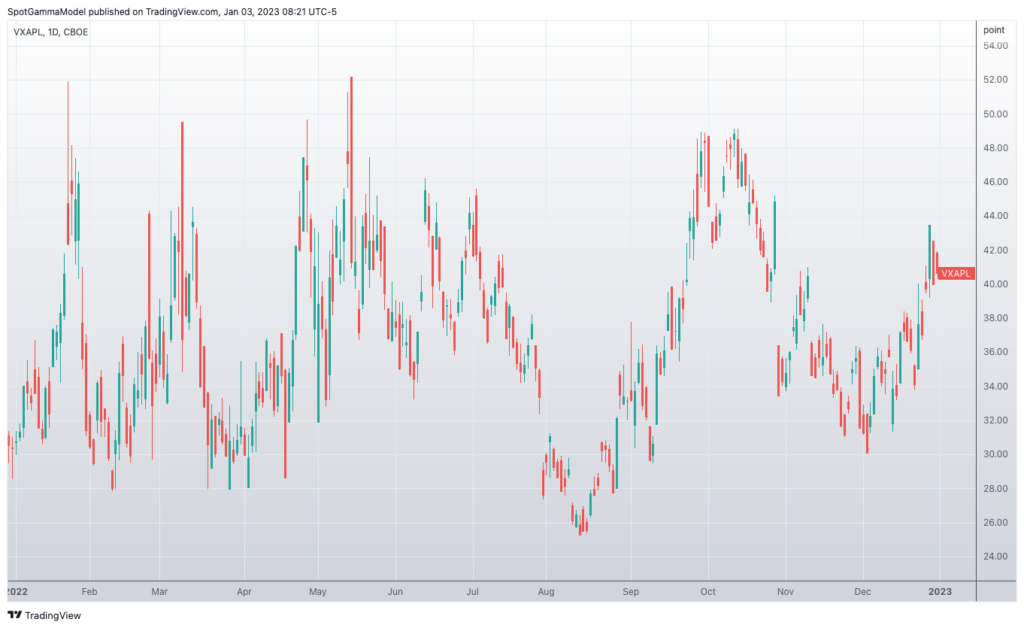
*For this reason we also think that traders idea of the VIX as a “fear gauge” will change to the VIX being a “volatility gauge”. This is because that long call demand could bring more consistent bouts of “VIX up, market up” as the VIX measure increases with rising SPX Index call options values.
| SpotGamma Proprietary SPX Levels | Latest Data | SPX Previous | SPY | NDX | QQQ |
|---|---|---|---|---|---|
| Ref Price: | 3839 | 3839 | 382 | 10939 | 266 |
| SG Implied 1-Day Move:: | 1.28%, | (±pts): 49.0 | VIX 1 Day Impl. Move:1.37% | ||
| SG Implied 5-Day Move: | 2.89% | 3839 (Monday Ref Price) | Range: 3729.0 | 3951.0 | ||
| SpotGamma Gamma Index™: | -0.61 | -0.61 | -0.25 | 0.02 | -0.06 |
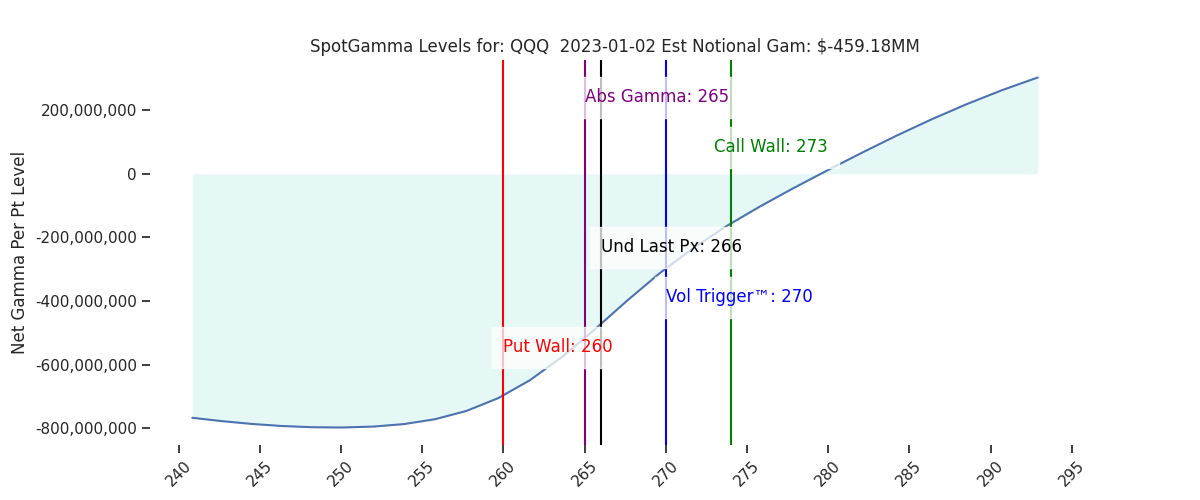
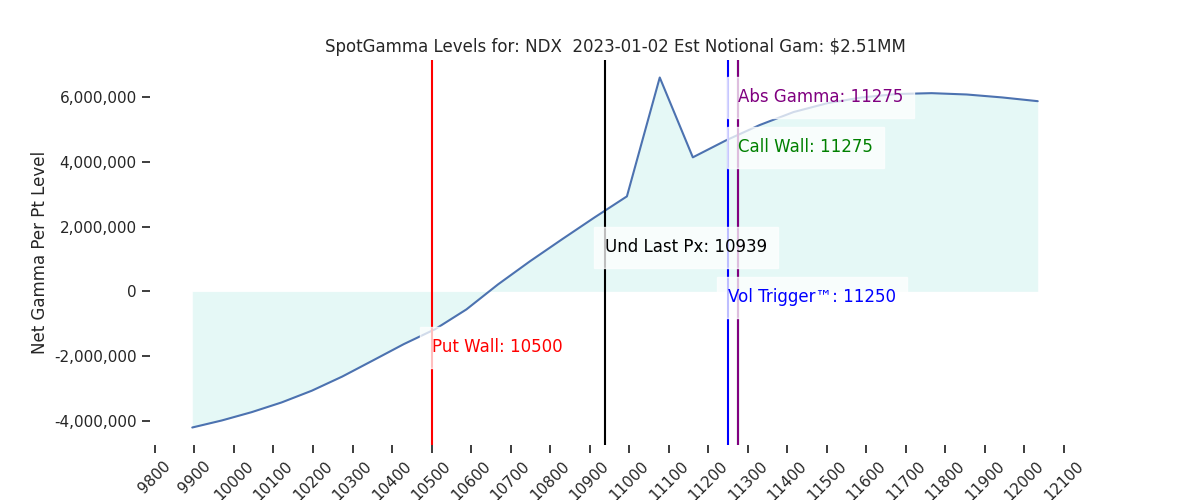
| Volatility Trigger™: | 3855 | 3855 | 386 | 11250 | 270 |
| SpotGamma Absolute Gamma Strike: | 4000 | 4000 | 380 | 11275 | 265 |
| Gamma Notional(MM): | -366.0 | -366.0 | -1292.0 | 3.0 | -459.0 |
| Put Wall: | 3700 | 3700 | 380 | 10500 | 260 |
| Call Wall : | 4000 | 4000 | 390 | 11275 | 273 |
| Additional Key Levels | Latest Data | Previous | SPY | NDX | QQQ |
|---|---|---|---|---|---|
| Zero Gamma Level: | 3900 | 3900 | 393.0 | 10613.0 | 303 |
| CP Gam Tilt: | 0.82 | 0.79 | 0.61 | 1.27 | 0.69 |
| Delta Neutral Px: | 3924 | ||||
| Net Delta(MM): | $1,408,688 | $1,408,688 | $146,924 | $37,160 | $77,714 |
| 25D Risk Reversal | -0.04 | -0.04 | -0.04 | -0.04 | -0.04 |
| Call Volume | 512,338 | 512,338 | 1,503,648 | 5,127 | 465,715 |
| Put Volume | 1,000,641 | 1,000,641 | 2,064,478 | 4,424 | 747,194 |
| Call Open Interest | 5,373,115 | 5,373,115 | 6,061,314 | 58,436 | 4,399,961 |
| Put Open Interest | 9,477,592 | 9,477,592 | 10,640,560 | 49,559 | 5,665,509 |
| Key Support & Resistance Strikes: |
|---|
| SPX: [4000, 3900, 3850, 3800] |
| SPY: [390, 385, 380, 375] |
| QQQ: [280, 270, 265, 260] |
| NDX:[12000, 11500, 11275, 11000] |
| SPX Combo (strike, %ile): [(4001.0, 82.6), (3924.0, 76.68), (3817.0, 85.65), (3801.0, 95.39), (3775.0, 81.53), (3767.0, 79.72), (3752.0, 92.8), (3717.0, 79.13), (3702.0, 95.66), (3652.0, 87.01)] |
| SPY Combo: [368.66, 378.61, 373.63, 363.69, 380.14] |
| NDX Combo: [11279.0, 10677.0, 10885.0] |
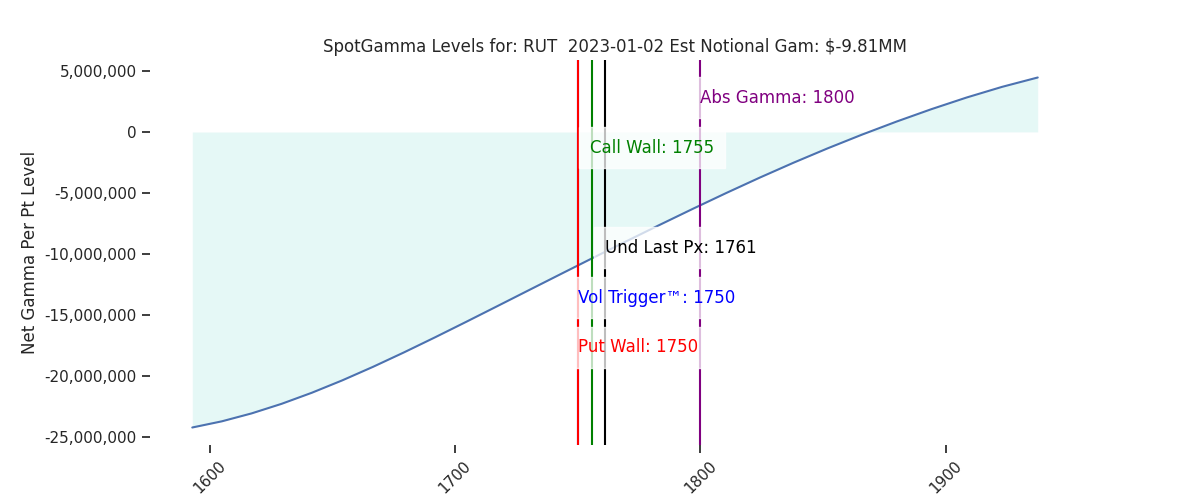
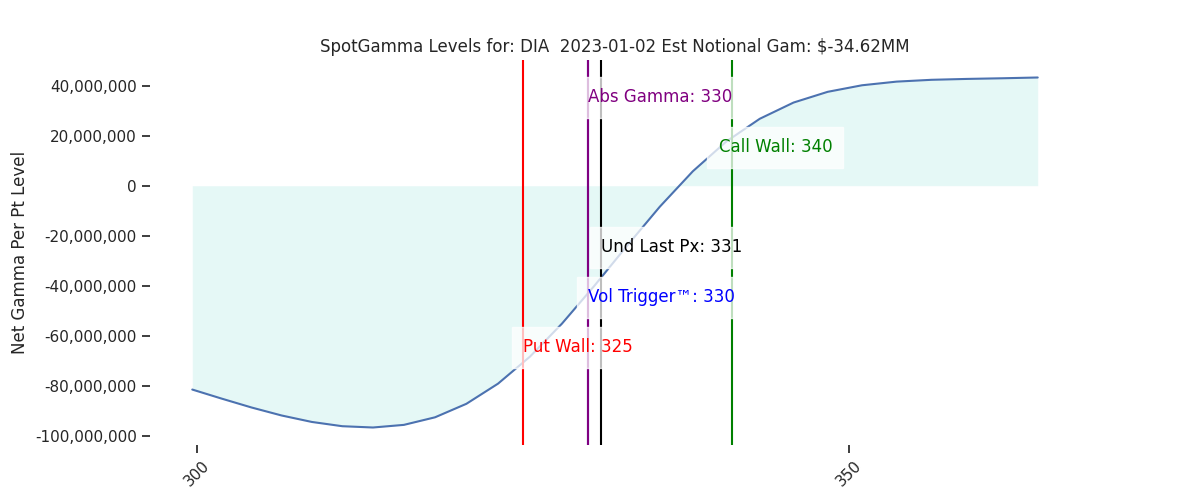
| ©TenTen Capital LLC d.b.a. SpotGamma Please leave us a review: Click Here |
| See the FAQ for more information on reading the SpotGamma graph. |
| SpotGamma provides this information for research purposes only. It is not investment advice. SpotGamma is not qualified to provide investment advice, nor does it guarantee the accuracy of the information provided. This email is intended solely for subscribers, please do not distribute the information without the express written consent of SpotGamma.com. |