Last week, strong earnings pushed both the S&P 500 and Nasdaq to — once again — achieve all-time highs. Through the fast and furious AI-driven rally of the past 6 weeks, SPX has climbed 15% while NDX has surged 28%. The market’s pace of advance is well beyond historical norms, reflecting an exceptionally aggressive repositioning into the semiconductor sector and Mag7 names.
With options activity stretching to extremes, two major events lie on the horizon: monthly OPEX on May 15, and Nvidia earnings on May 20. Index price action is likely to remain muted until these dates have passed. However, the conditions that fueled the past month’s rally could easily unwind afterwards, leaving the market vulnerable to resumed volatility.
Semiconductors: Parabolic Move, Growing Questions
No sector has better captured the intensity of this rally than semiconductors, and the SMH ETF has surged 36% over the past six weeks. Individual names show even more extreme moves: INTC +220% from March lows, MU +140%, QCOM +87%.
These parabolic moves raise questions around sustainability as options activity grows increasingly crowded in semi names. Call volumes in several AI-related names have even exceeded index-level activity, highlighting growing speculative demand. Implied volatility has expanded meaningfully, making additional long call exposure quite expensive.
NVDA remains the key earnings catalyst. While recent order flow shows bullish trades (e.g., calls and calendar spreads), overall positioning appears mixed. SpotGamma’s Synthetic OI model shows that notable long call positions have opened in NVDA alongside sizable short call structures — meaning traders may be hedging a range of earnings outcomes.
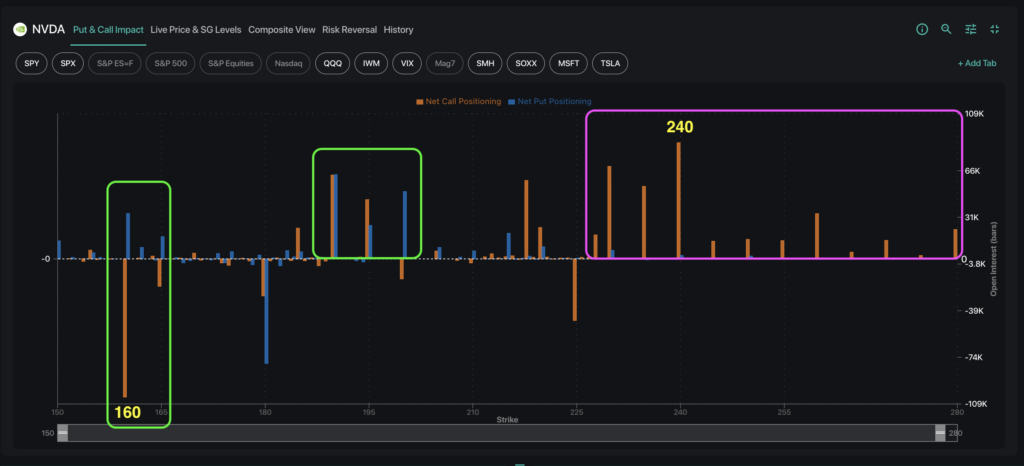
Note that NVDA’s Skew Rank sits at 99.2%, indicating that calls are extremely expensive relative to puts. This can simultaneously unlock the call-buying FOMO traders, while attracting volatility sellers to short options given the rich premium.
Key Dates Ahead: Is Volatility Underpriced?
The SPX Term Structure reveals that NVDA’s May 20 earnings date remains one of the most important market dates ahead, with OPEX on May 15 as the other. Forward implied volatility remains elevated, suggesting the market may be underpricing the magnitude of potential post-event movement.
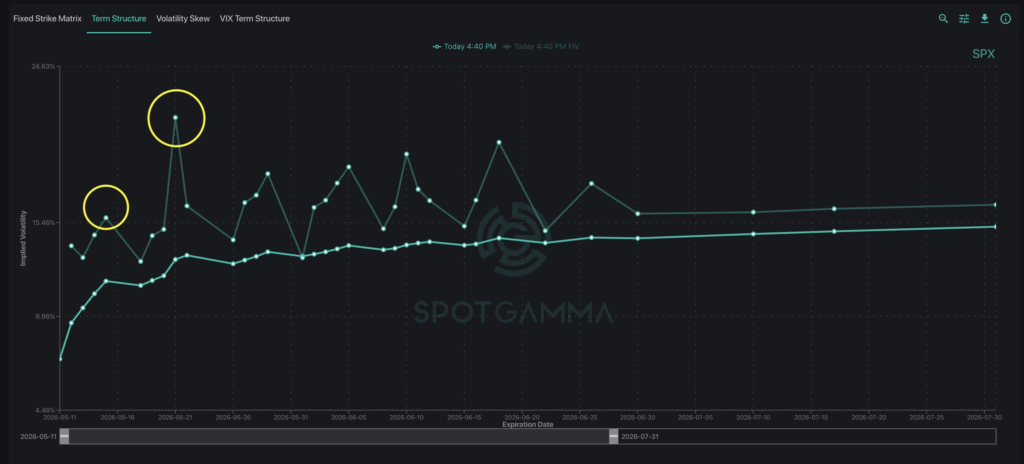
Monthly expiration cycles typically bring meaningful gamma roll-offs as major options positions and dealer hedges expire. This means that Friday’s expiration could reverse the stabilizing effect of dealer hedging, allowing for larger price moves.
The base case is for implied volatility to compress into OPEX as event risk is deferred, followed by potential expansion following NVDA earnings. Note that this also coincides closely with VIX expiration on May 19. That timing creates a natural window for markets to reprice volatility.
Until then, macro headlines — such as geopolitical developments or peace deal narratives — may continue to suppress perceived tail risk and support the current risk-on environment.
SPX: Intraday Squeeze Dynamics Despite Low Volatility
While much of our recent analysis has focused on single stocks and the recent call-buying frenzy, an equally interesting phenomenon has unfolded in major indices.
The past few weeks have seen the re-emergence of the familiar Seek-and-Destroy algo trade. This trade involves systematic SPX options-buying activity until price has achieved a specific target — typically, a major strike holding massive gamma.
As an example, on May 6 we observed that traders had established significant 0DTE positions at SPX 7,360 with 35k short call contracts. Market Makers — as the liquidity provider — were long these calls, placing the market in a positive gamma regime (visible as blue zones in the TRACE Gamma heatmap below).
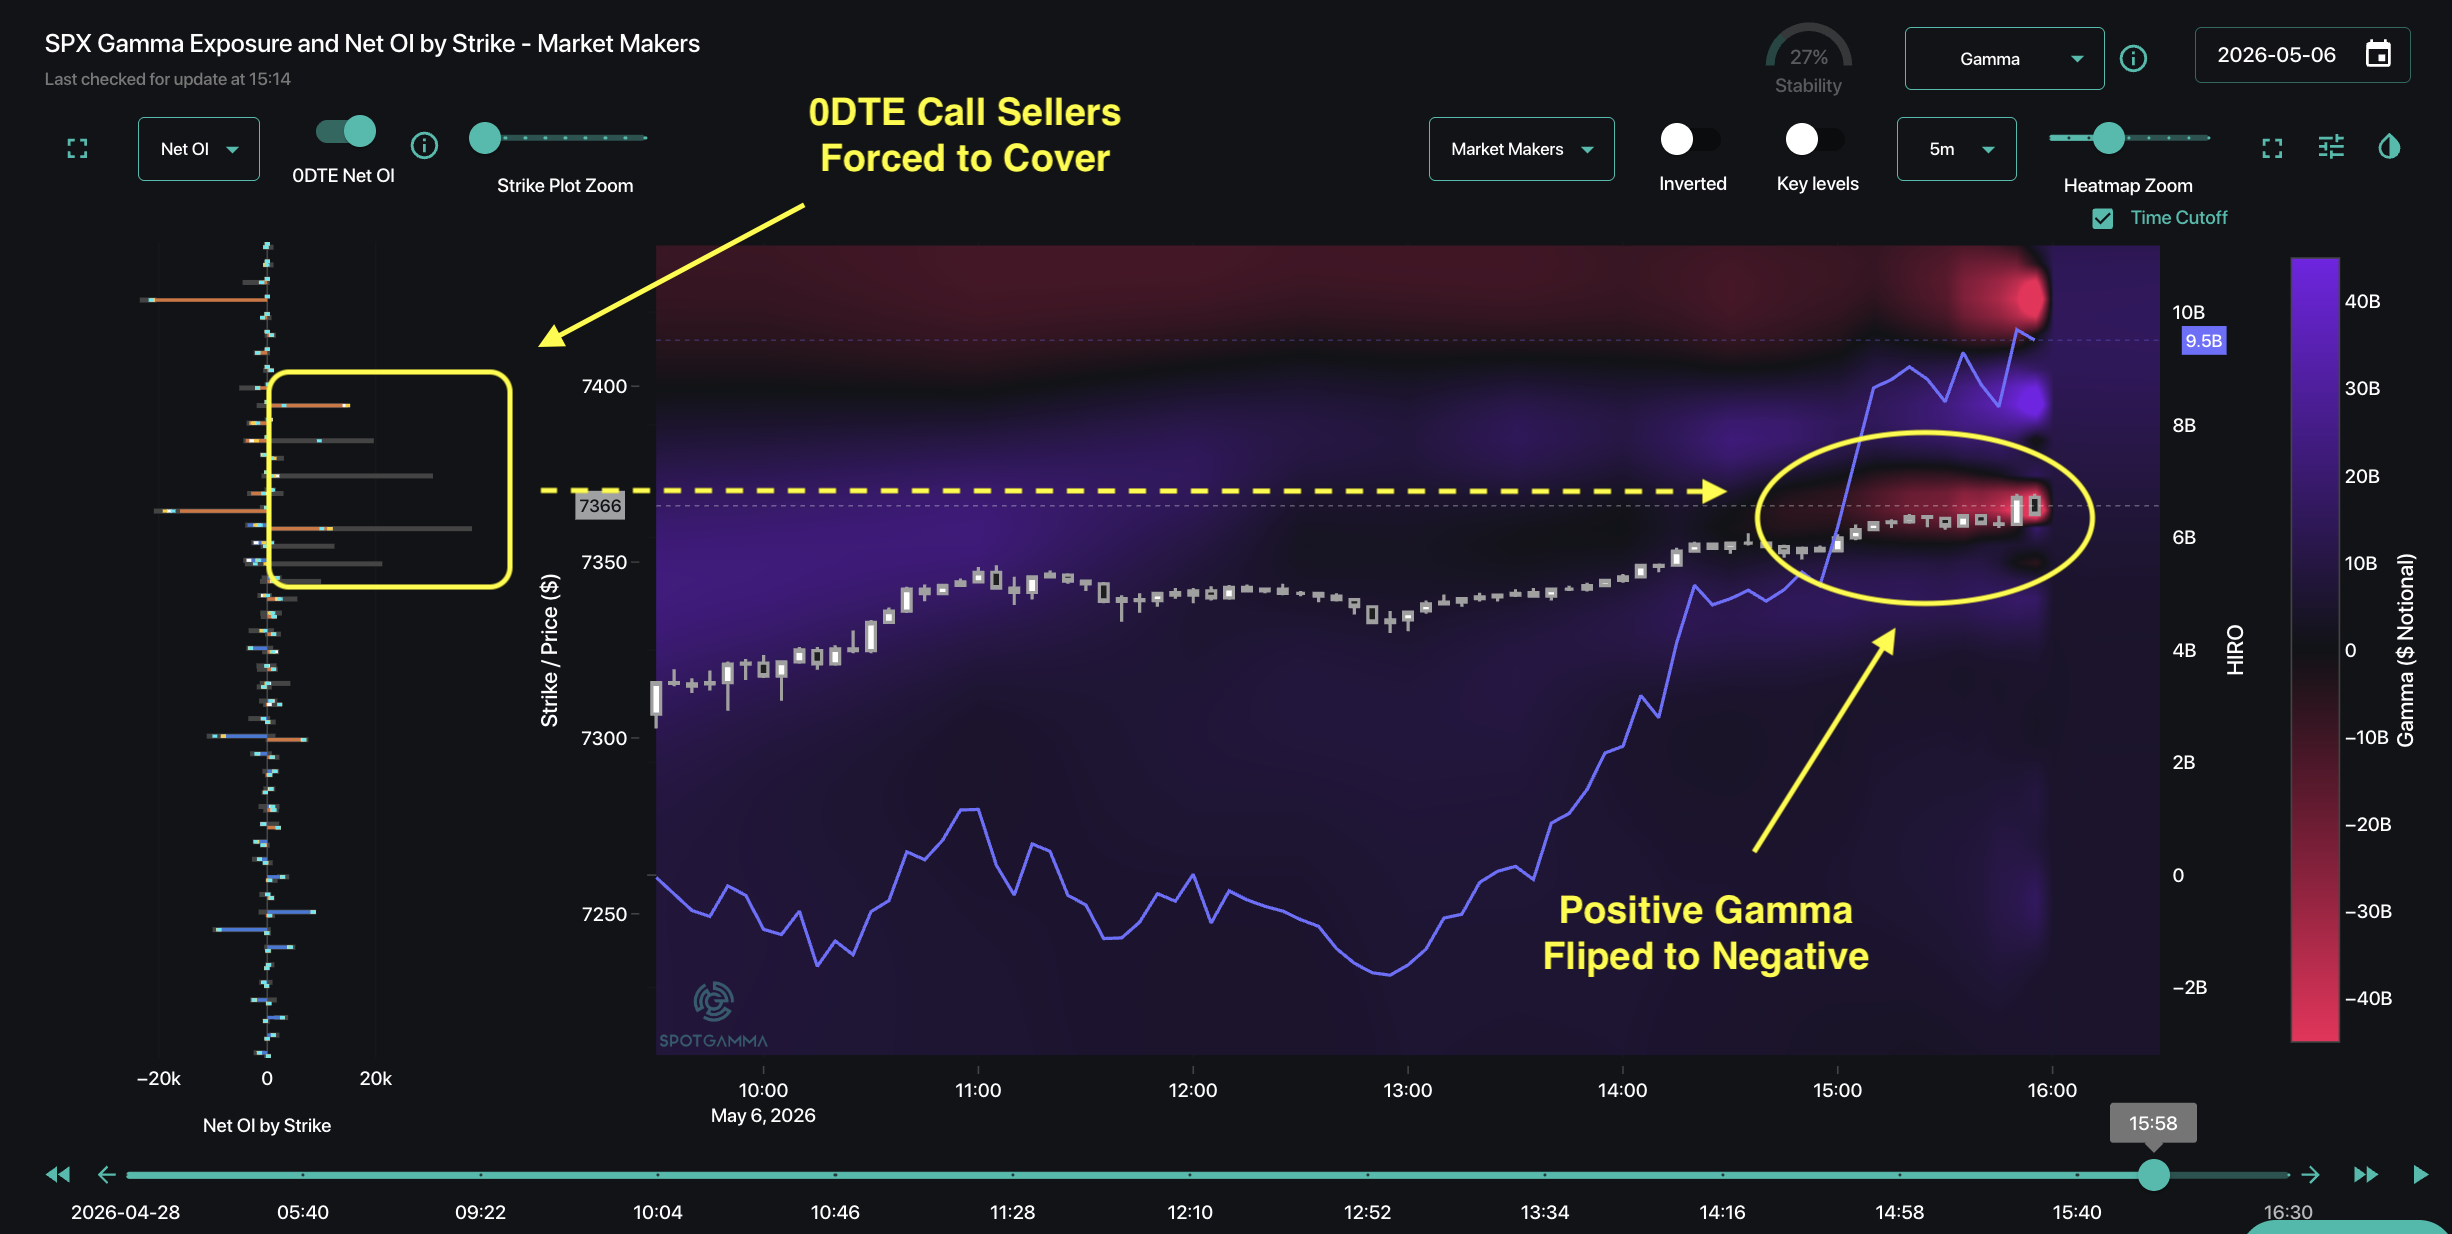
In the afternoon, systematic buying drove SPX price upwards — forcing short call holders to cover. This intense switch from trader call-selling to call-buying flipped the local gamma regime from positive (blue) to negative (red) around the 7,360 area.
Gamma is most sensitive near at-the-money strikes and in near-dated options, so this late afternoon activity injected significant 0DTE negative gamma into the market. The resulting hedging flows reinforced the upward move, acting as an accelerant to already-strong momentum and allowing price to leap higher as resistance dissolved.