The market experienced a meaningful shift this week as SPX declined nearly 3% from the all-time highs of October 29, closing Friday at 6,729. What began as fluid, transient price action evolved into more concerning market dynamics by the end of the week.
The week’s volatility behavior differed markedly from the tariff-induced selloff on October 10. While both declines saw similar percentage moves, this past week actually showed more contained volatility — VIX around 20 versus 28+ in October. This suggests that last week’s decline was driven more by call selling than panic put buying.
However, the emergence of put skew widening for SPX, particularly for extreme tail moves, shows that traders are beginning to hedge a wider range of price movement. This means we are not quite out of the woods yet.
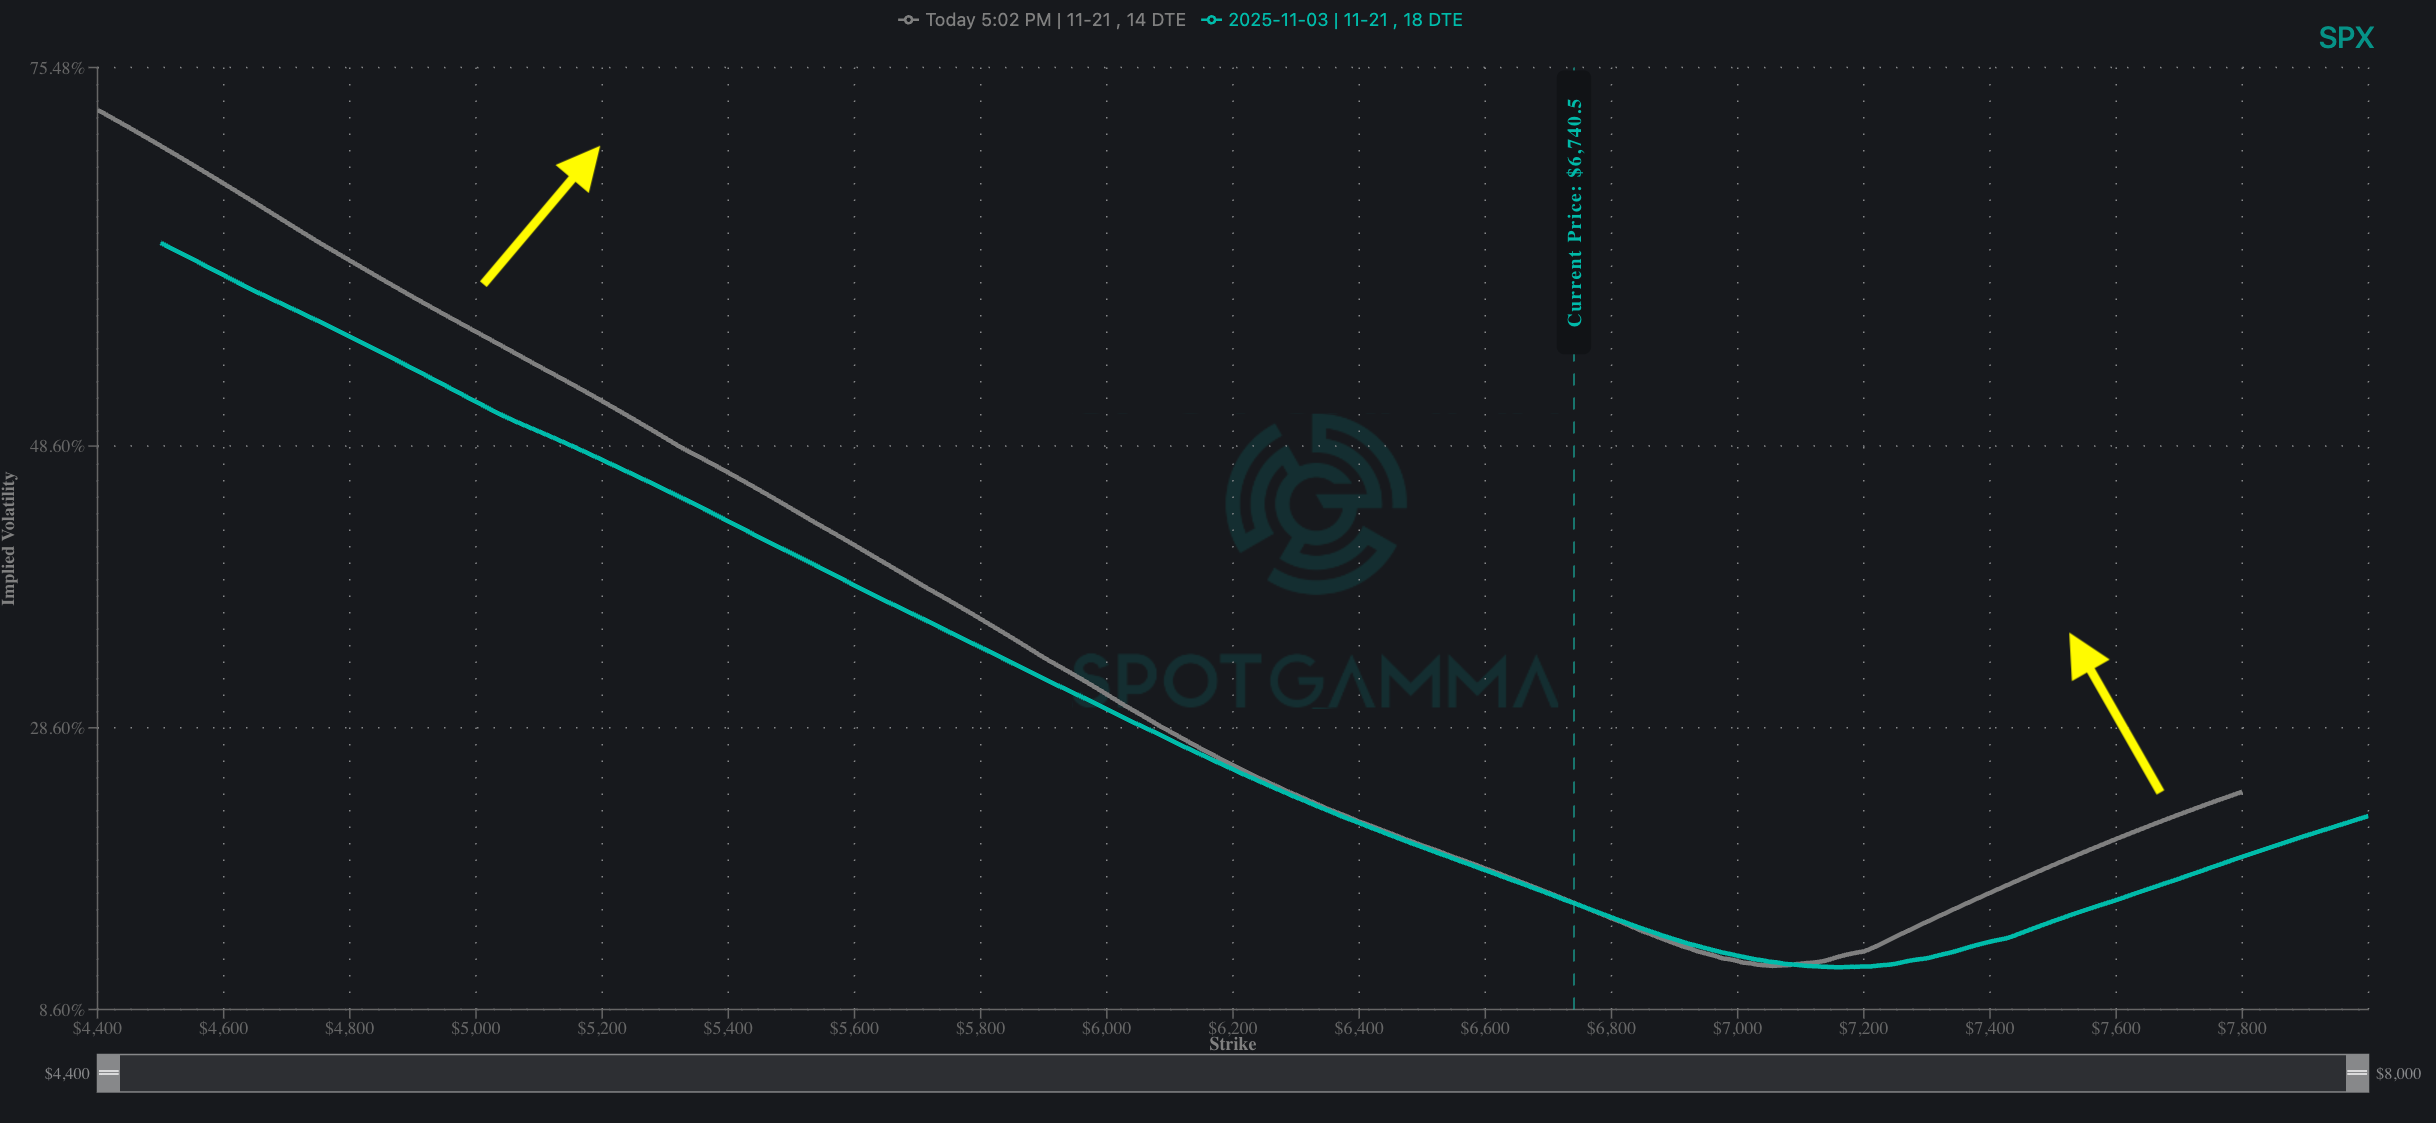
Signs of stress have also appeared in the past 10 days in other asset classes: following FOMC, 10-year treasury bonds rose from 3.9% to 4.1% while bond-sensitive ETFs initially flipped from call-heavy to put-heavy. Crypto weakness pushed Bitcoin below $100k for the first time in months.
The critical question remains: Will traders take profits at current price levels and grab downside protection, which could exacerbate the move below the 6,500 – 6,600 range through dealer hedging flows? Or, will vol sellers step up once again to sell higher premium puts, pushing IV down and helping the market glide to 7,000?
Next Week’s Setup: Navigating Negative Gamma
We find ourselves in a precarious position heading into the new week. The 3% decline feels considerably worse than similar percentage moves because of what’s happening beneath the surface: negative gamma surrounding current price levels, emerging non-0DTE put buying, and widening put skews indicate that traders do not feel “hedged enough” to the downside after October’s furious rally.
Looking out over the next two weeks, our Forward IV-adjusted Term Structure reveals NVDA 11/19 earnings as the most significant event on the calendar. This gives way to 11/21 OPEX, making the week of 11/17 a major turning point for risk.
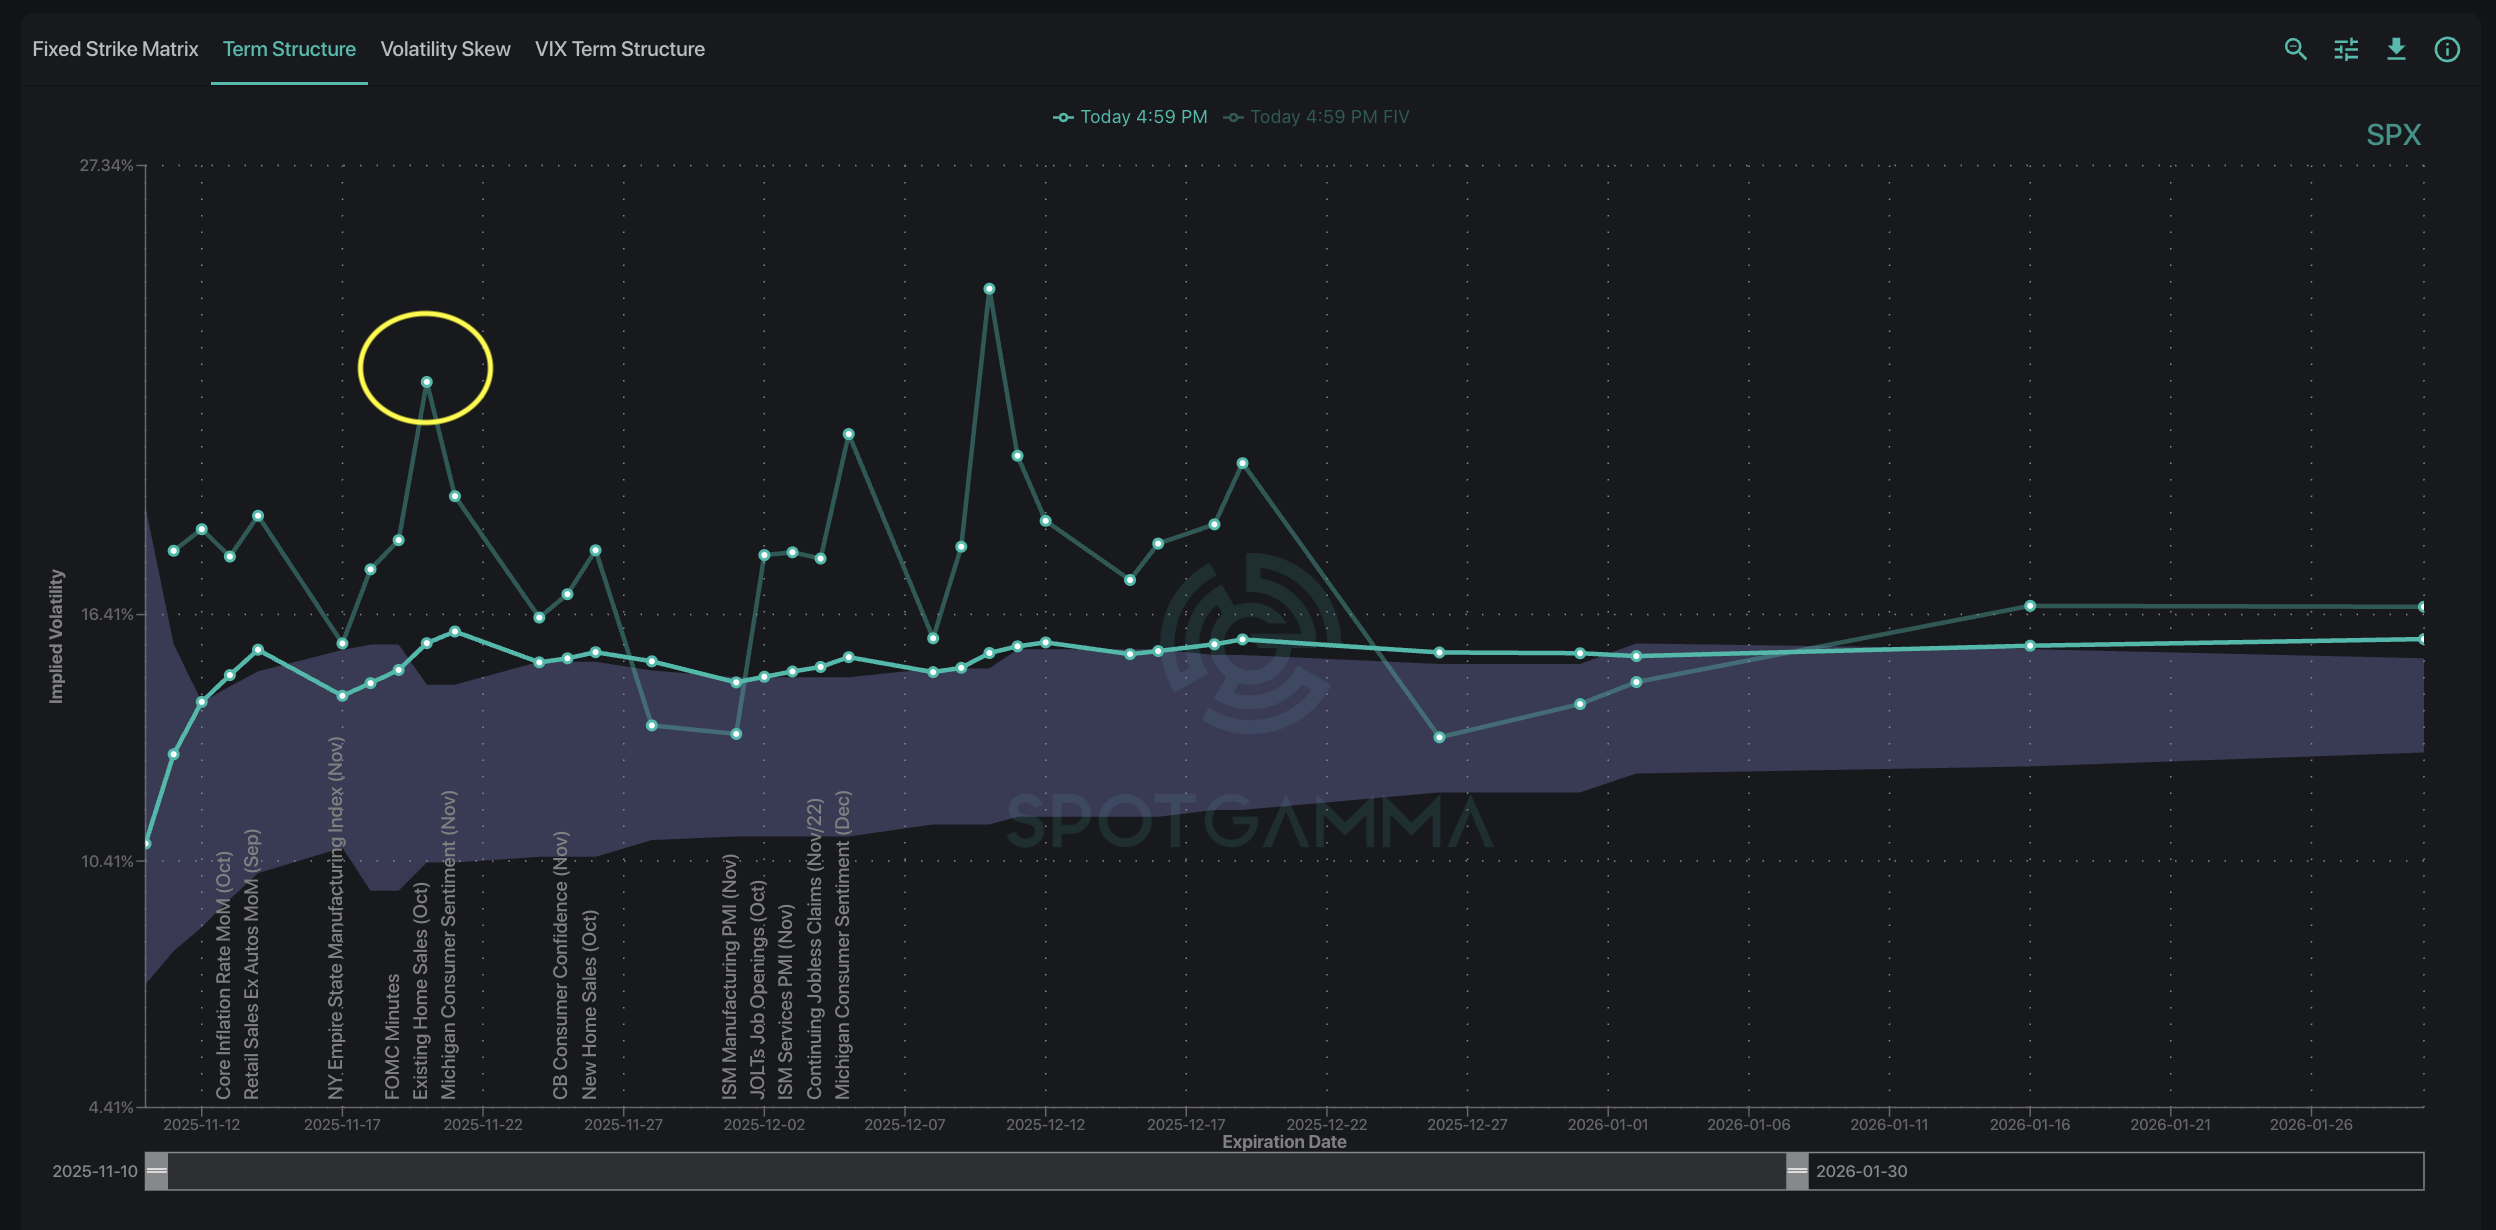
The AI/Semi narrative remains the key driver of positive market sentiment, and NVDA’s report will either validate or challenge that bullish thesis.
The earnings spotlight for the week ahead also features several names worth watching:
- 11/13: AMAT – semiconductor equipment
- 11/12: CSCO – networking equipment and enterprise tech bellwether
- 11/13: DIS – streaming and entertainment sector
Single Stock Highlight: PLTR’s Valuation Reality Check
Palantir’s post-earnings action captured attention as the proverbial canary in the coal mine. Despite an earnings beat, PLTR plummeted 18% under continued selling over the next four trading sessions.
This was highly significant since PLTR entered earnings as the most expensive S&P 500 stock with a P/E of 666. The shocking earnings reaction therefore represents potential valuation concerns spreading across growth names with extreme P/E ratios.
While this may indicate weakness in the evolving AI and tech narrative, the options market paints another interesting picture. Strong positive gamma at the 170 strike provides support for PLTR, while pronounced negative gamma at 180 may be important to monitor as an acceleration point.
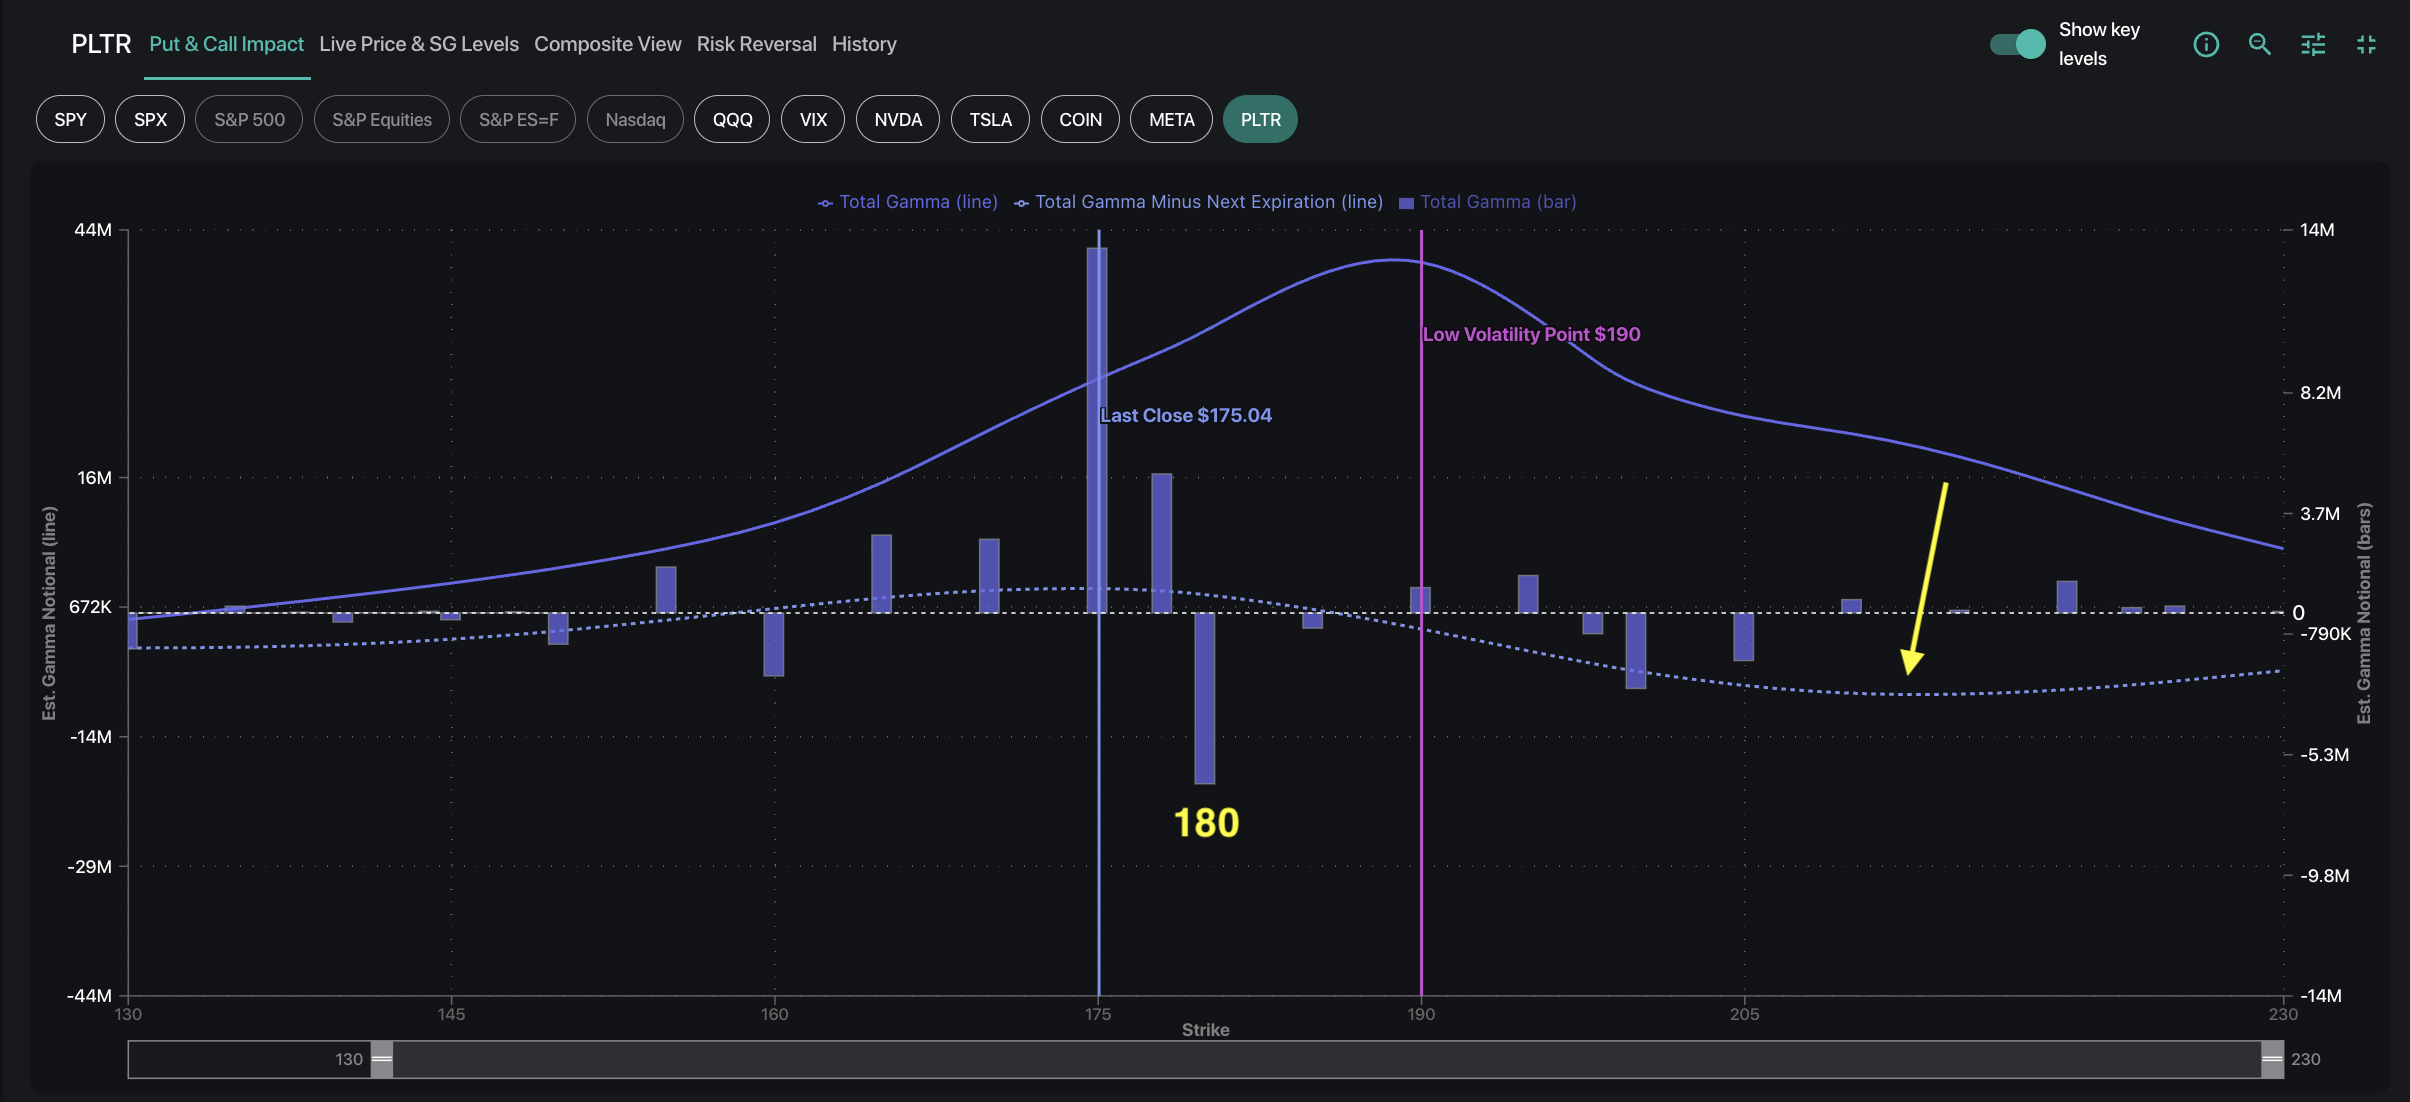
As noted on the above chart, PLTR now has mostly negative gamma overhead after Friday’s weekly expiration — which could point towards a bullish setup into a year-end Santa Claus rally.
If you want these insights provided to you pre-market each day, sign up for SpotGamma today and get access to world-class insights supported by real-time analysis, so you can optimize your trading and protect your PnL.
Now Available: SpotGamma’s Q3 2025 Report Card
SpotGamma’s latest Quarterly Report Card shows how our expert analysis helped traders anticipate major market shifts — even to the exact handle — ahead of the crowd throughout Q3.
- In July, we highlighted cheap SPX puts before the vol snapback
- In August, we flagged risk of downside ahead of the PPI readout
- In September, we issued a risk-off warning before PCE inflation data shocked markets
These are only a few highlights from last quarter. Every morning, SpotGamma traders use our Founder’s Notes and world-class indicators to gain an edge they can’t get anywhere else.