The S&P 500 has bounced back to record highs, closing decisively above 7,100 after Friday’s 1.2% rally. That marks a 12% rise from March lows in just under three weeks.
In that same timeframe, volatility expectations have seemingly collapsed: VIX is down 40% since March 31, dropping from >30 to below 18. Crude oil has stabilized below $90 as geopolitical tensions eased, although renewed weekend escalation around the Strait of Hormuz risks another price shock.
Without any long-term resolution to the Iran conflict, it seems unusual that markets are again achieving record highs. This raises two key questions: what drove last week’s dramatic rally, and where does the market go from here?
Record Call Buying & the Dealer Dynamics Behind the Rally
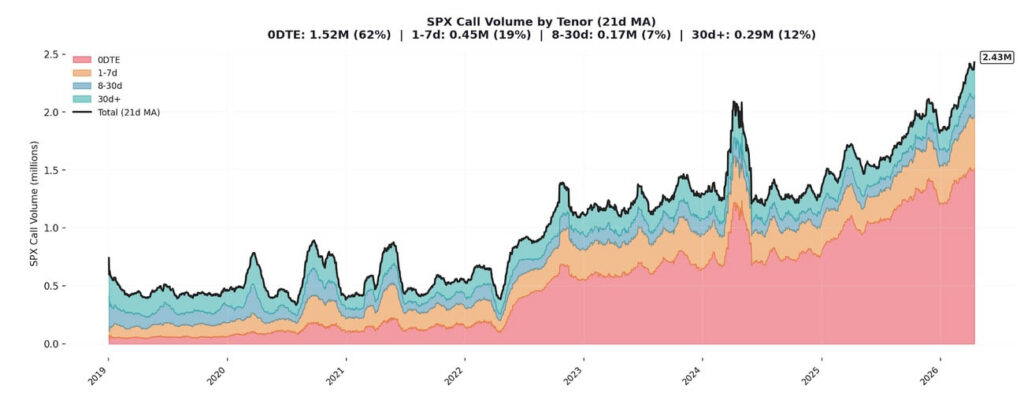
Peeling back the data, one very interesting piece of information stands out: the last two weeks have witnessed a surge in options activity, particularly in out-of-the-money calls being bought. The frenzy of call buying comes from a mix of both genuine optimism, FOMO, and forced hedging.
On April 15, our HIRO Indicator recorded net delta flow of over $15 billion for the S&P complex — one of the largest single-day readings in our database. Roughly $13 billion of that flow came from call buying alone, driving upward price momentum. This indicates that dealer hedging has played a significant role in the climb back to record market highs.
With the S&P 500 heavily lopsided towards call-buying, the trader-dealer dynamic matters considerably. When traders buy calls, the dealers who sell those calls need to buy futures to remain delta-neutral. As the market rallies, the value of those calls increases, and dealers must buy additional futures to hedge. This creates a self-reinforcing feedback loop that provides sustained bids to the market.
Beyond the major indices, single-stock options flow also showed robust demand for out-of-the-money calls. Last week, call skew for AMZN options hit the 73rd percentile (more expensive than 73% of days in the past year), and AAPL call skew simiarly reached the 65th percentile. Both names were up 4-5% for the week, indicating elevated demand for upside exposure across the market.
OPEX Removes Key Layer of Market Stability
The call-buying frenzy and dealer mechanics that drove last week’s rally could now see those same dynamics break down following April OPEX week. With Friday’s expiration behind us, structural support that had been quietly stabilizing markets has rolled off.
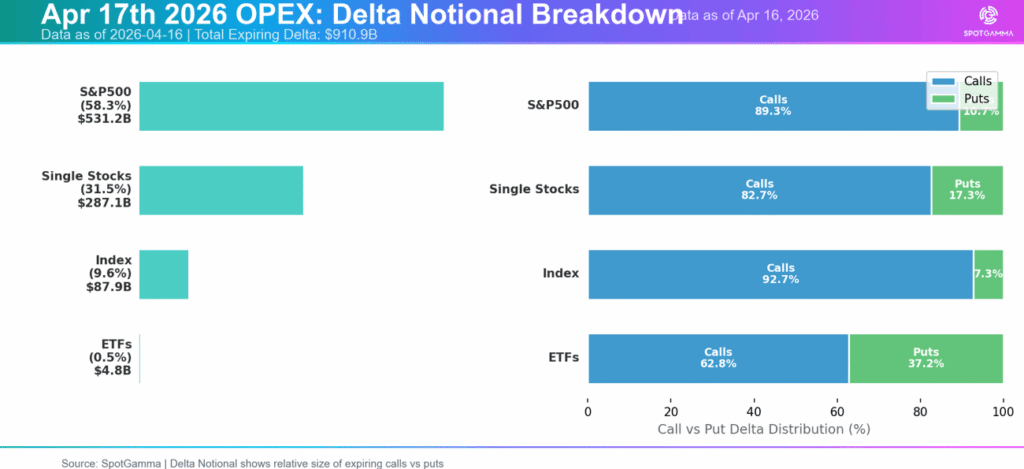
April OPEX was overwhelmingly call-heavy, consisting of nearly 90% calls for S&P 500-tracked instruments.
The unwind from Friday’s expiration changes the prevailing environment in two ways: First, OPEX clears long call positions that had driven the market upwards. Second, the S&P 500 complex now faces a neutral-to-negative dealer gamma environment, which opens the door to more fluid price action in the coming days.
Volatility Discrepancy Creates Trade Opportunities
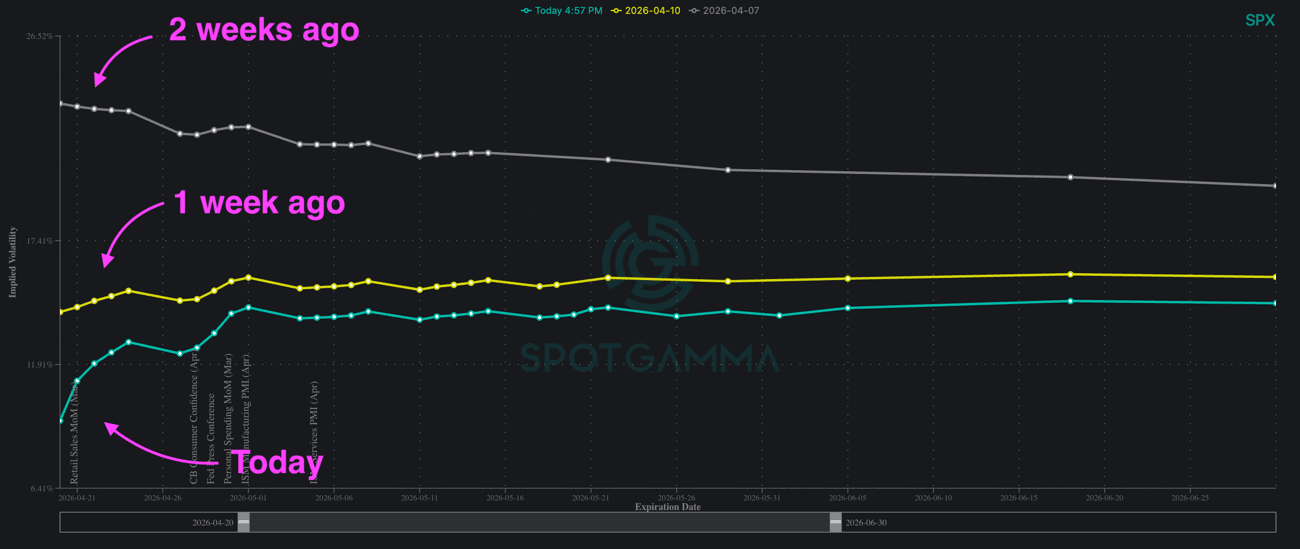
As a feature of last week’s rally, the SPX Term Structure has compressed dramatically across virtually every expiration. Currently, at-the-money IV for contracts expiring May 22 sits at ~14%. However, 1-month realized volatility is closer to 19%.
The gap in realized-versus-implied vols means that options traders are pricing in calmer conditions than the market has actually observed in the past several weeks. When realized volatility runs well above implied volatility, options may be cheap relative to price action.
Given the collapse in implied volatility (and thus cheaper options prices), what are some ways traders can play this environment?
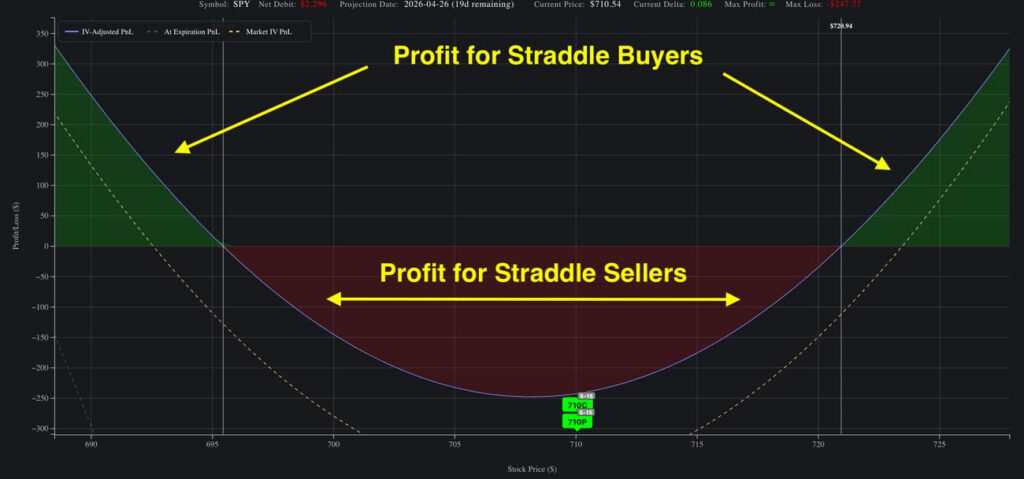
As we discussed in last Monday’s webinar with Jeff Tompkins, the current environment generally points to long volatility structures over short premium strategies. In particular, straddles or strangles may provide favorable risk-rewards setups. In order to visualize potential PnL before entering a trade, SpotGamma’s Options Calculator offers pre-set strategy templates to help get started.
One of the most powerful features of our Options Calculator is the volatility adjustment window, which allows you to model both changes in IV and shifts in skew. If you are anticipating that vols rise following OPEX — or for call skew to flatten — you can input your projections and view how that impacts the return profile of your trade. This provides a more realistic simulation of outcomes rather than a static snapshot.
The Week Ahead: Will the Rally Extend or Reverse?
While OPEX certainly changes the environment, that does not necessarily mean the rally is over. However, traders who chased calls into all-time highs should be aware that the same mechanics that pushed markets up can also lead to sudden reversals.
Managing position size remains critical, and we encourage you to leverage our Options Calculator to stress-test your trades. Upcoming catalysts — including Tesla earnings (after close on April 22) — could act as triggers for volatility expansion that are worth preparing for.
