The following is a guest post from Doug Pless.
When I plan to trade stocks for the day, I begin my morning preparation by opening my watchlist in Equity Hub. I look at the Key Gamma Strike, Hedge Wall, and other metrics and compare the values with the previous values for the last five days. I also look at the SG Momentum Indicator for stocks that I am considering trading during the day.
The Key Gamma Strike is a strike where volatility may increase or decrease. The Hedge Wall is the strike where the largest change in gamma is detected. Both levels can act as pivot or pin areas. A large amount of hedging flow may be linked to the Key Delta Strike, particularly as it goes in the money.
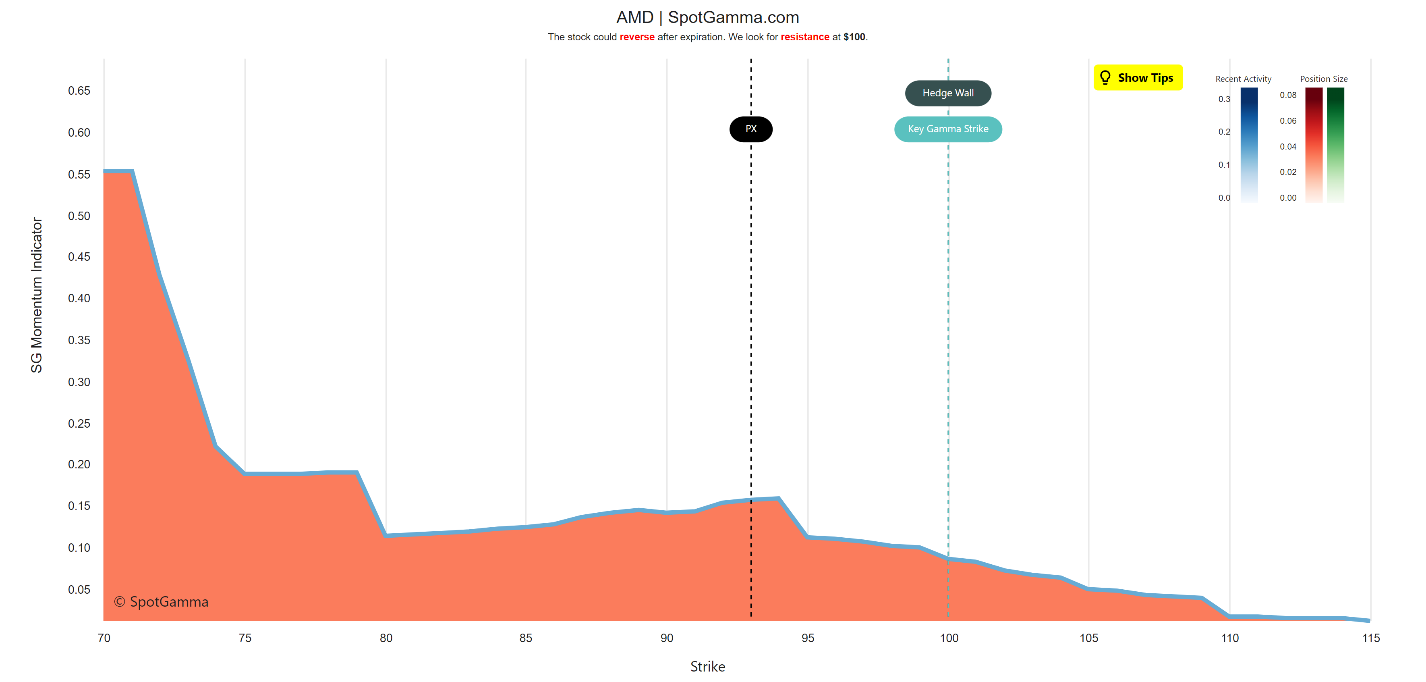
The SG Momentum Indicator shows gamma hedging volatility. The color of the graph indicates whether the options complex for the stock is dominated by calls or puts. Red indicates puts are in control, and green indicates calls are in control. The shade of the graph indicates position size. The scale is shown in the legend in the upper right corner.
Finally, I watch the SpotGamma HIRO Indicator in the first minutes of trade after the open for the stocks that I plan to trade. The HIRO Indicator shows the Market Maker hedging impact of options trades. Market maker hedging flow can have a significant influence on order flow in stocks and is often a good confirmation of price direction. Please see this article for more detailed information on how I use HIRO to trade stocks.
Based on this information, I develop a thesis and directional bias for the day. An example of how I used this information to plan and execute a trade in AMD is shown below.
AMD Trade Analysis: May 26, 2022
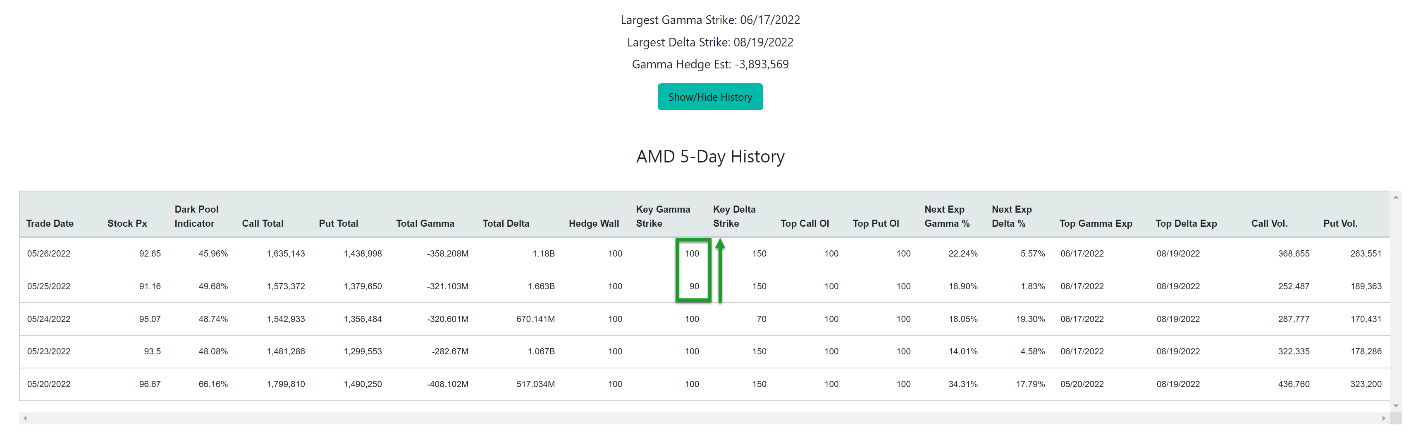
On May 26, the following metrics for AMD were shown in Equity Hub:
- Key Gamma Strike: 100 (Previous day 90)
- Hedge Wall: 100 (Previous day 100)
- Key Delta Strike: 150 (Previous day 150)
The Equity Hub 5-Day History for AMD showed that the Key Gamma Strike rose higher from the previous day. I interpreted this as a bullish signal. The Equity Hub 5-Day History for AMD is shown below.
The AMD SG Momentum Indicator diagram from Equity Hub for May 26 showed the previous day closing price level (PX) at 92.65. This level was below the Key Gamma Strike and Hedge Wall at 100, noted as resistance. The lighter red color indicated moderate options size and that puts were driving the price action. The indicator also showed that gamma hedging volatility would decrease slightly as price moved higher toward 100. The AMD SG Momentum Indicator model from Equity Hub is shown below.
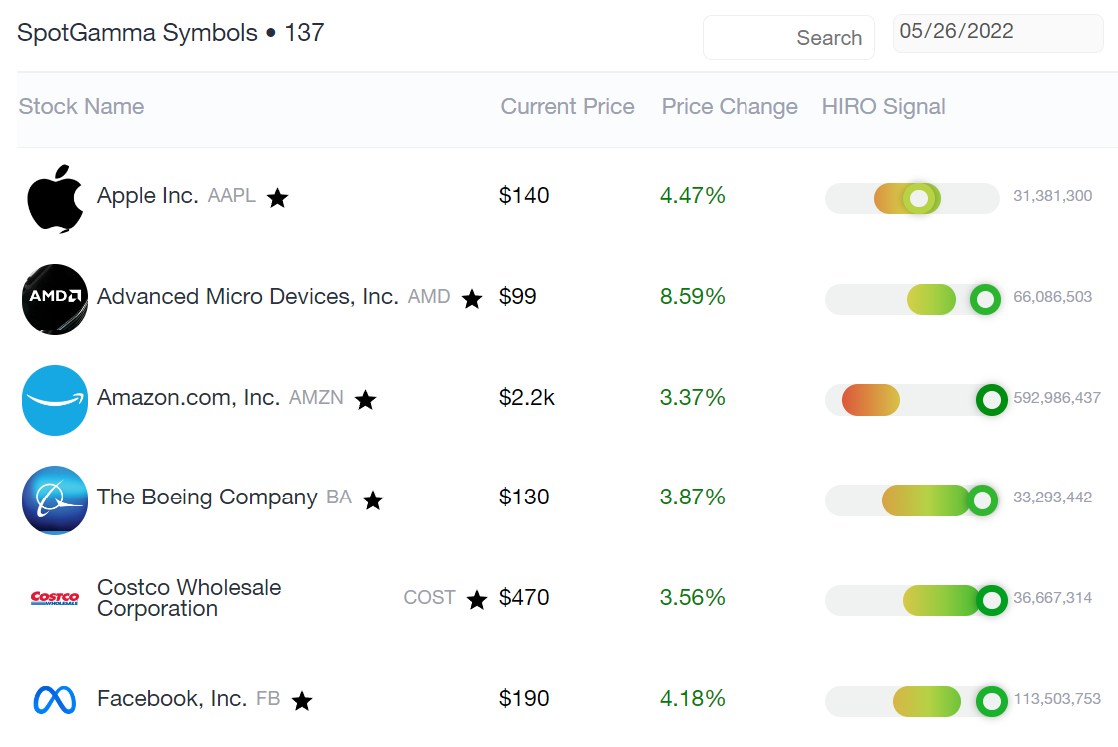
I scanned my watchlist in SpotGamma HIRO a few minutes after the open. Several stocks, including AMD, showed very strong HIRO Signals. The signals were at the top of the recent 5-day and 30-day ranges for these stocks. Based on the strong HIRO Signal and rising Key Gamma Strike, I decided to focus on AMD. A portion of my SpotGamma HIRO watchlist (screenshot taken at the end of the day) is shown below.
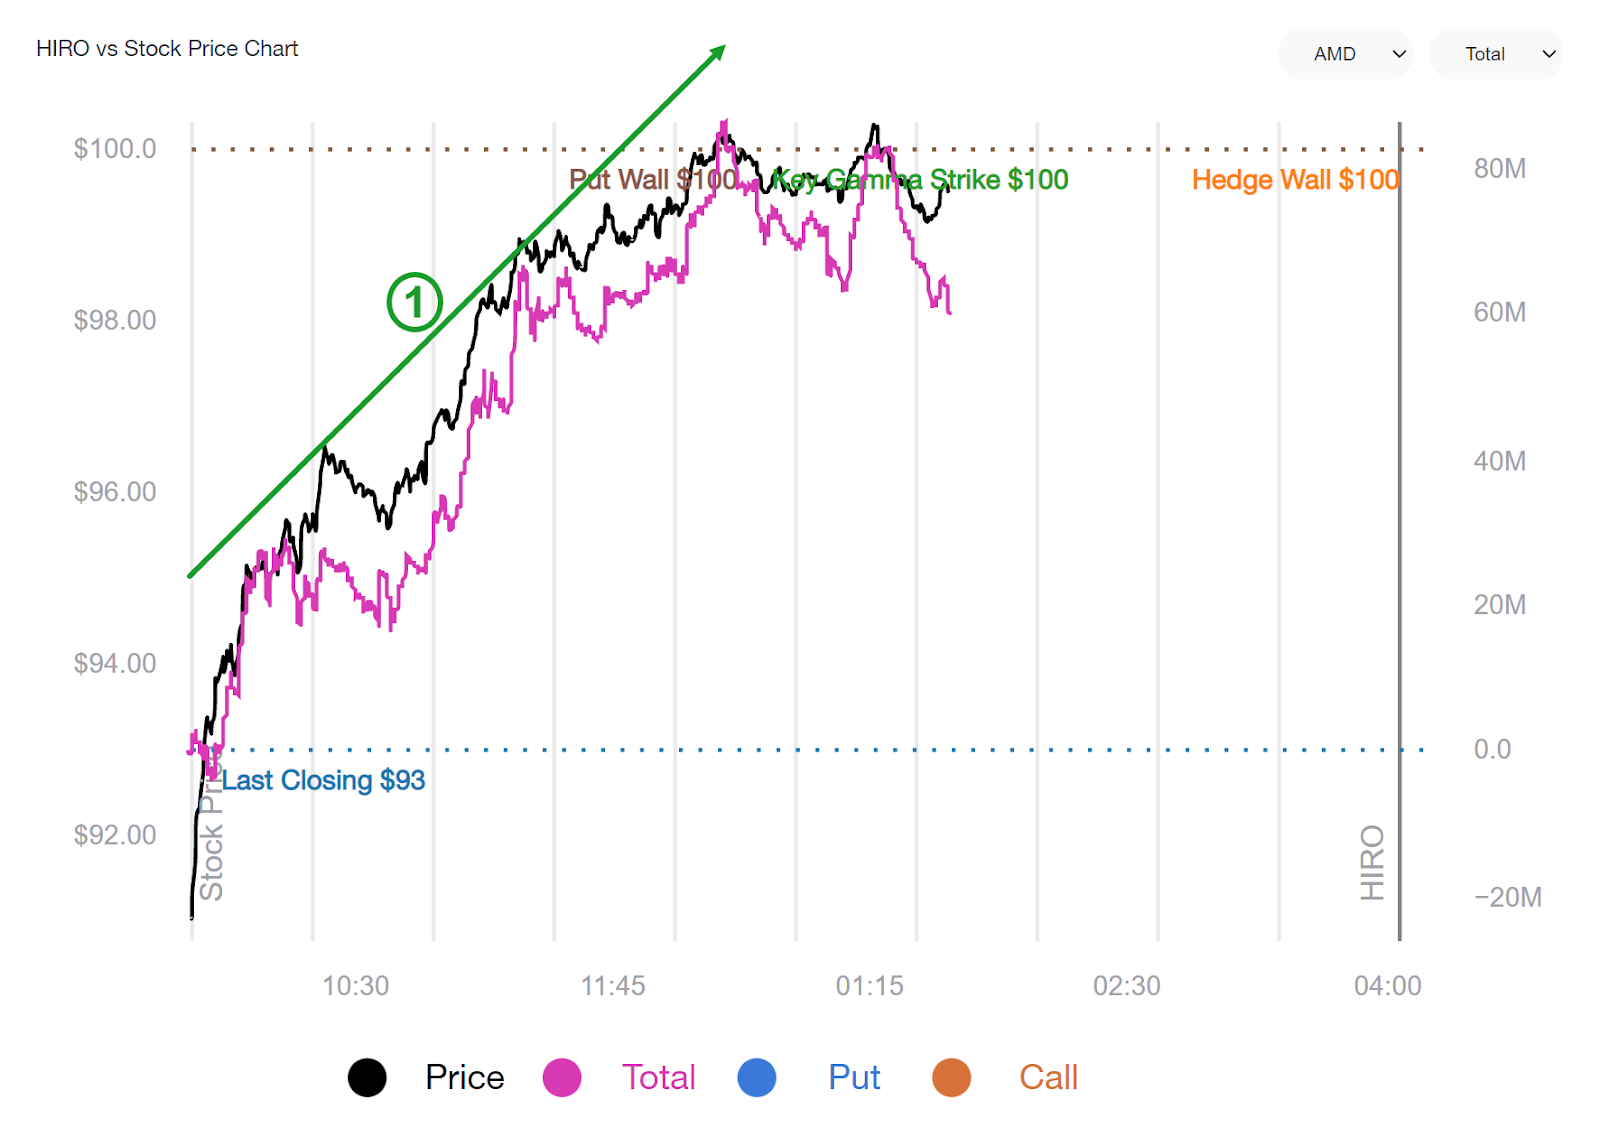
After the open, traders immediately began buying calls and selling puts as shown in the SpotGamma HIRO chart below. If traders buy calls and sell puts in a stock, market makers take the opposite side of the trades, selling calls and buying puts. Since market makers want to remain delta neutral, they buy stock to hedge their delta risk. Based on the strong bullish HIRO Signal and hedging flow shown by SpotGamma HIRO, I was looking for long entries in AMD.
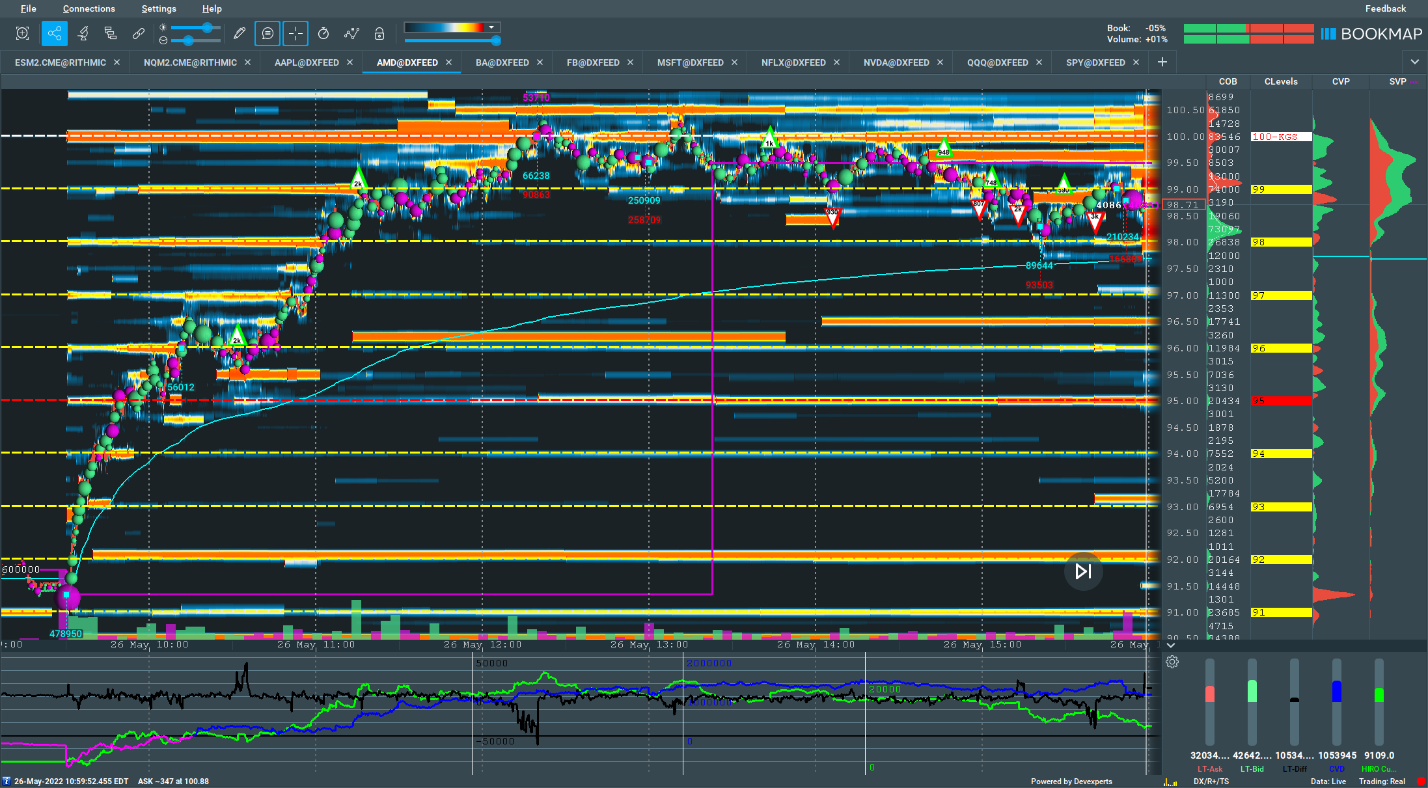
Bookmap HIRO also indicated that market maker hedging flow was bullish, as shown by the upward-sloping HIRO Indicator (green line in the sub-chart) in the Bookmap chart below. The indicator showed that market makers were buying stock to hedge bullish option trades. There were several long pullback and breakout setups (labels 4 and 5) as market makers continued to buy stock and aggressive buyers moved price higher to the high liquidity exit target (label 6) at the 100 Key Gamma Strike.

The Bookmap chart below shows how the day played out. The 100 Key Gamma Strike level held as resistance as anticipated. After reaching 100, AMD traded in a narrow range between 99 and 100 for the rest of the day, as HIRO and Cumulative Volume Delta (pink/blue line in sub-chart) leveled off.
Resources
For further definitions and information on the terms used in this article, please see the SpotGamma Support Center for a list of dozens of SpotGamma proprietary terms, as well as context for common market terminology.
SpotGamma Products Used: