Key Points:
- Low index volatility coupled with higher stock volatility points to bullish conditions
- While volatility (i.e. market movement) almost always expands the week following OPEX, don’t expect much of that this month due to a comparatively small May OPEX
- NVDA is the stock to watch, with potential to drive S&P500 even higher after its earnings on 5/22
A Brief Synopsis:
Large call positions are driving low volatility into May options expiration. The expiration of call positions lines up with several key data points (Fed Speaking, CPI) which may cause volatility to briefly expand into the end of this week (Friday, 5/17), and into VIX expiration & NVDA earnings on 5/22.
To this point on volatility expansion, our data shows that +90% of time realized volatility (a.k.a SPX Index movement) increases in the week after options expiration.
However, volatility “works both ways”, so while many frame OPEX as opening a “window of weakness”, we think one should see it as a “window for volatility expansion”.
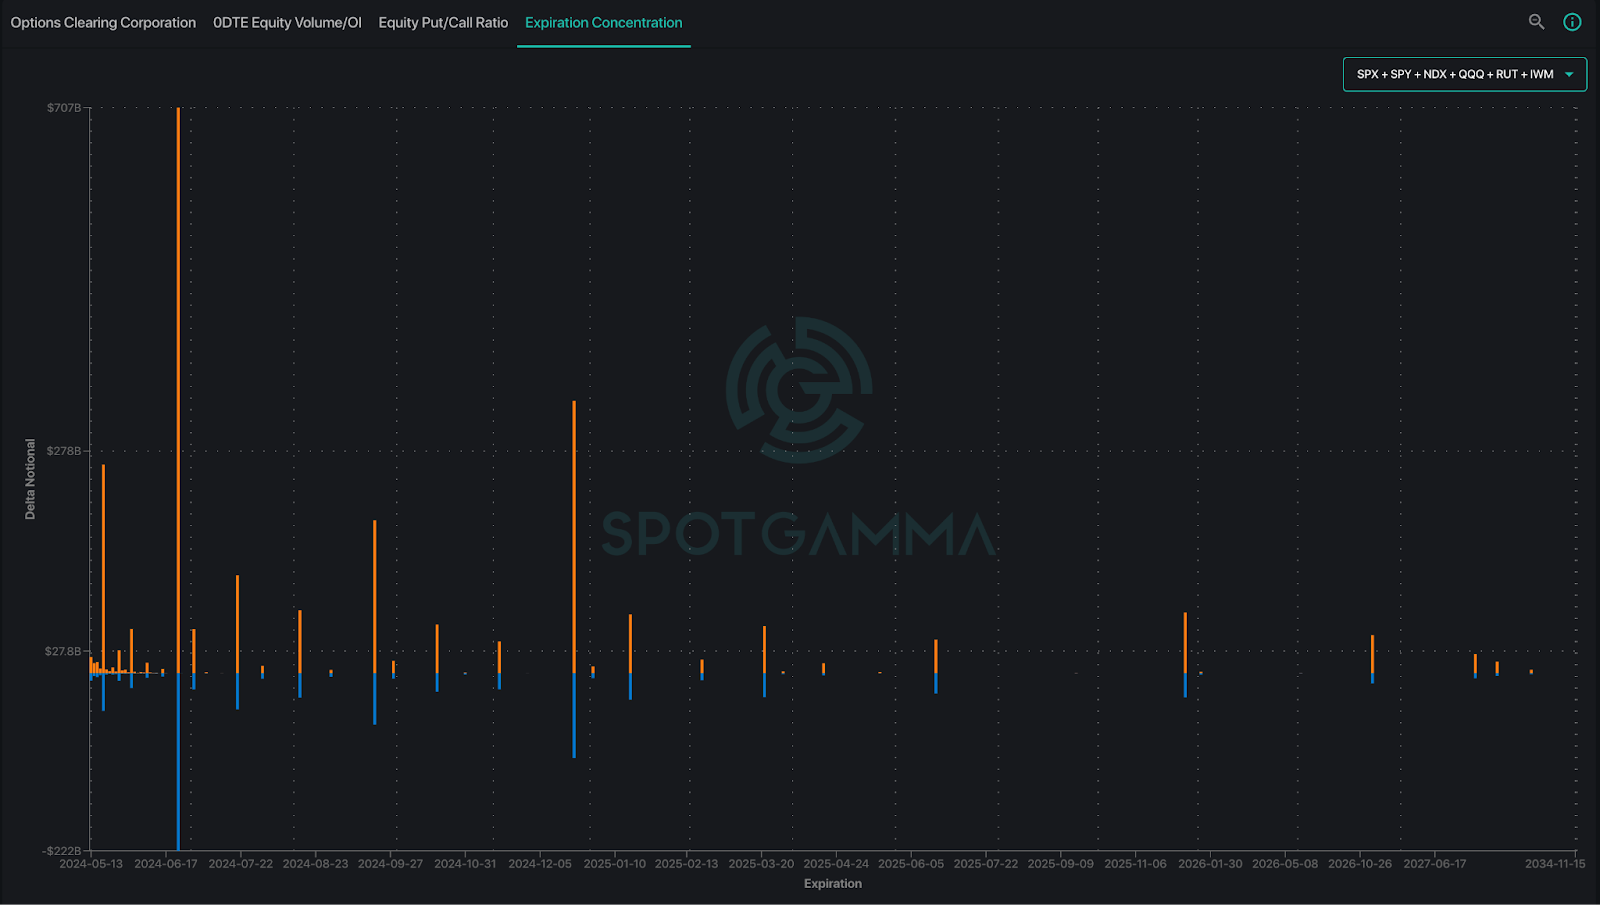
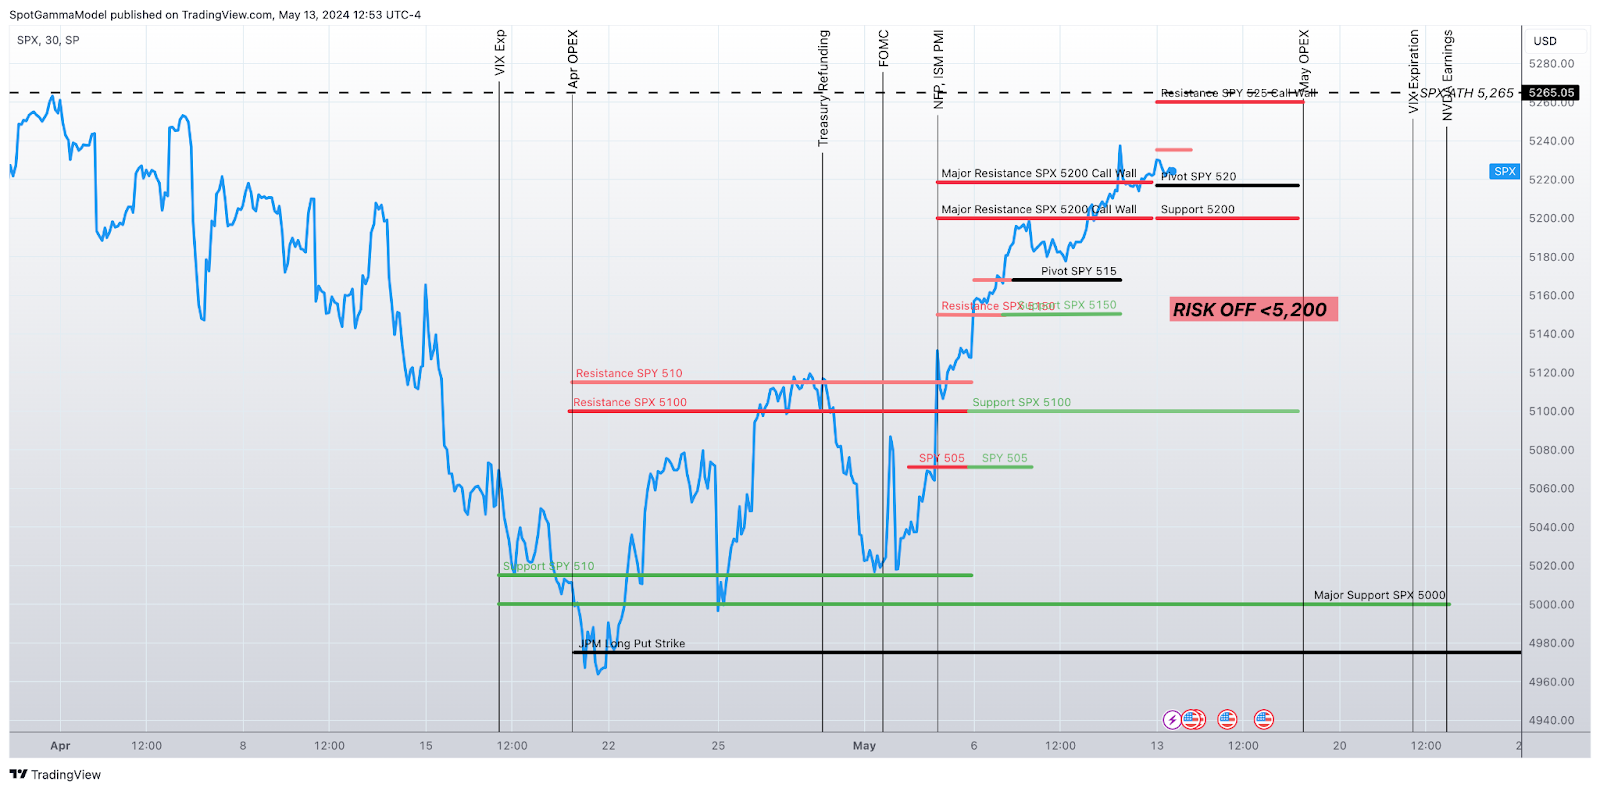
As shown below, May is not a particularly large expiration (June Exp is 3x larger), and so we expect more of a “speed bump” versus large shift in volatility. Our expectations for higher volatility would change greatly if the SPX breaks below 5,200.
Key Levels:
5,300 is our max high into 5/17, with NVDA earnings opening an opportunity for further highs into the end of May.
To the downside, should 5,200 break at any time, we would shift to a risk-off stance, looking to be long equity puts and/or VIX calls.
The Details:
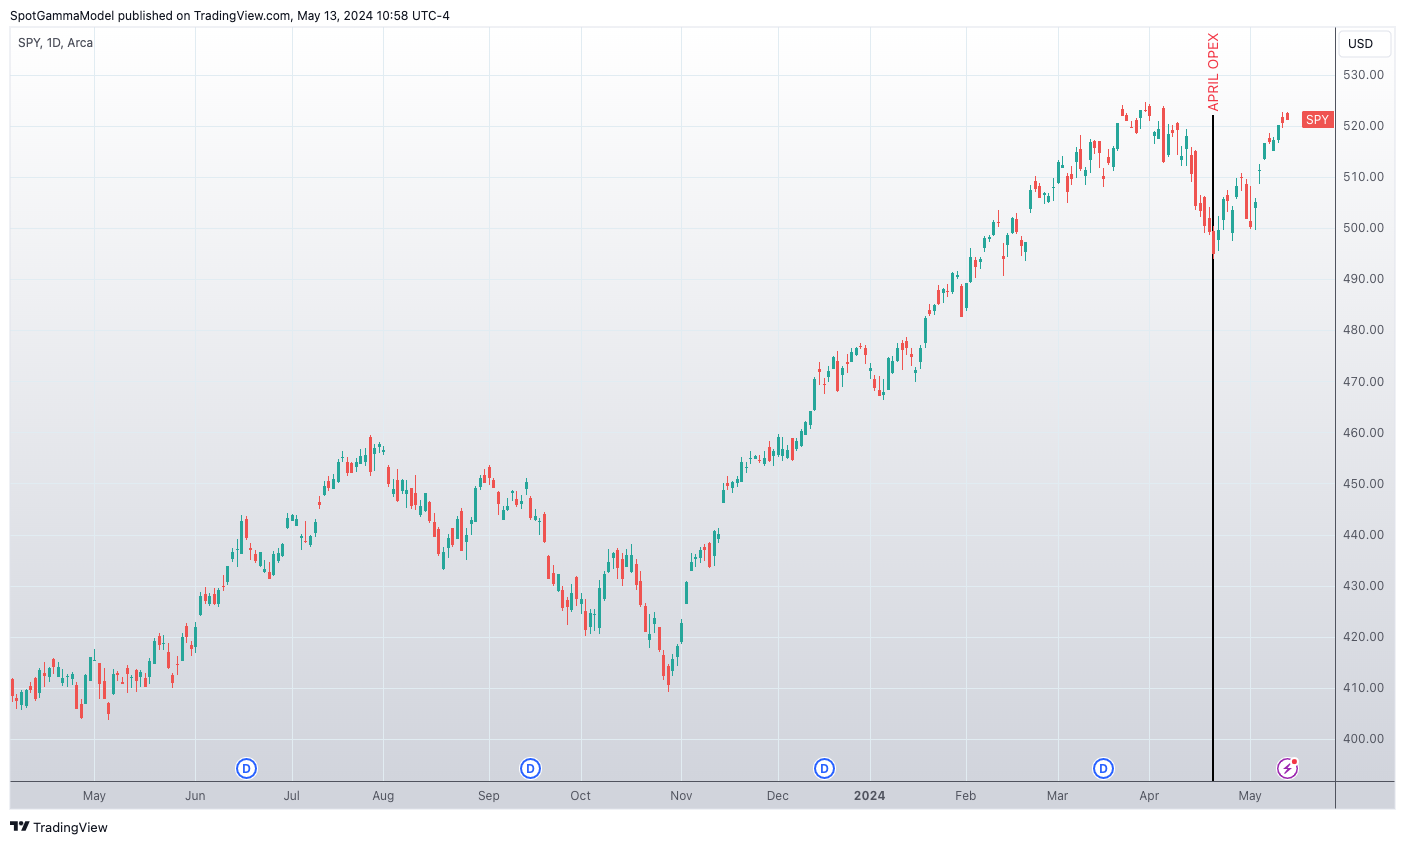
Before we dive into the dynamics of the May 2024 options expiration, we wanted to review the volatile trading in April, as it set the stage for current price action. Specifically, we believe that the unwind of April volatility highs drove equities back near current all-time highs, and a lack of demand for put protection suggests traders may take equities higher into June.
April was a relatively volatile month, starting with intraday all-time-highs in the SPX Index near 5,265, before sliding more than 5.5% lower to 5,000. Interestingly, the S&P500 bottomed on April OPEX day, 4/19. April OPEX served to significantly reduce equity put positions, which we believe reduced selling pressure.
What drove April volatility?
Heading into April there was an unprecedented level of calm in index volatility as the S&P500 surged to new highs.
SpotGamma penned a piece about this unusual calm, titled “Volatility Suppression” highlighting how the combined flows from massive call overriding programs and zero DTE trading could be limiting market movement. These flows drove index volatility lower.
Conversely, there was large demand for single stock call options in very specific sectors such as semiconductors and infrastructure. These flows drove single stock volatility higher.
To measure these relative flows we refer to the three month correlation (COR3M) which is shown below. This metric measures the relative implied volatility [IV] of SPX Index options, vs the IV of the top 50 stocks in the S&P500.
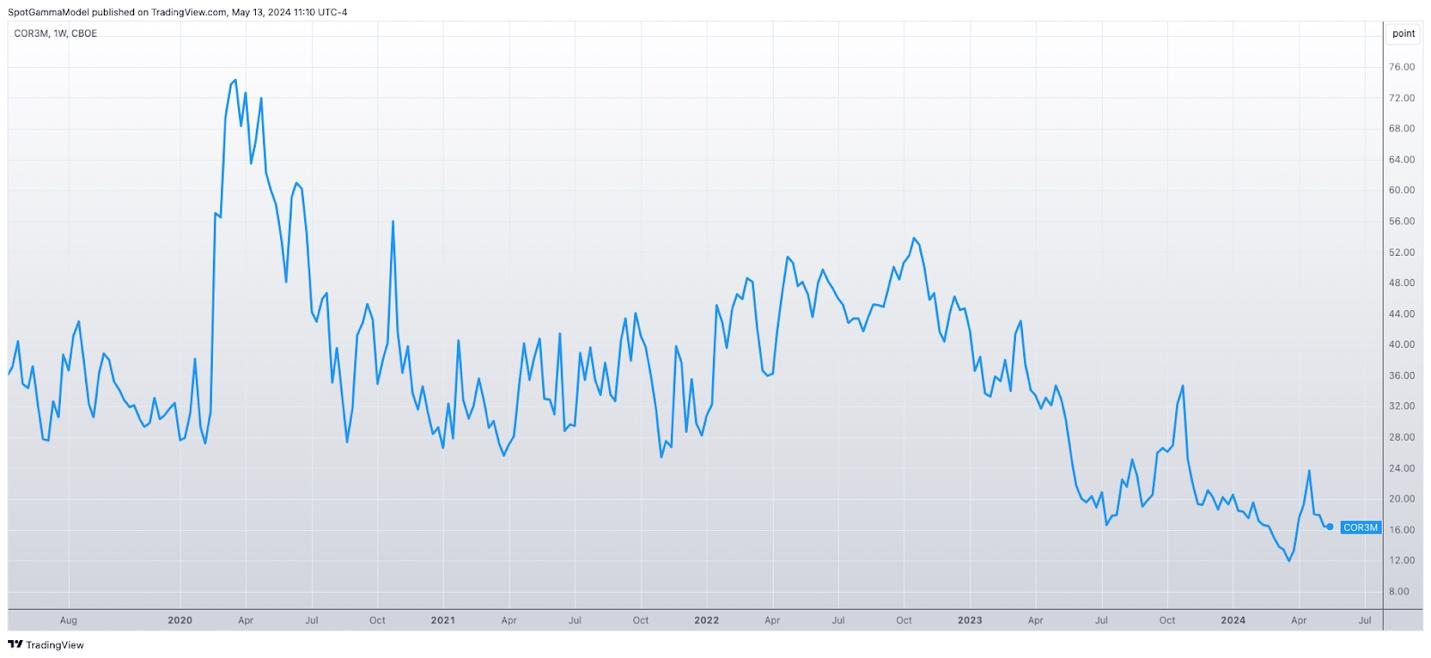
As you can see above, the COR3M hit all-time lows at the end of March 2024. This signaled that traders expected individual stocks to have much higher volatility relative to the index. Previous studies show that this phenomenon is often related to extreme bullishness, as traders focus turns away from macro conditions to specific stock selection.
During times of great fear, like March 2020 correlation snaps higher (highs on the chart, above), as all equities are sold off in unison.
As April progressed, the specter of higher rates and geopolitical angst suddenly brought macro concerns to the forefront. The result was a correlation unwind in which both index measurements and single stocks all declined sharply.
However, the sectors that had been outperforming the most into April felt the most pain from the April drawdown. This suggests that April weakness was, in a large part, an unwind of the extreme single-stock-bullishness that pushed equities to all-time highs.
Consider NVDA, arguably the top US stock – after being up nearly 100% in 2024, it lost more than 20% from its 3/25 high to its 4/19 low. Moves like this led to correlation metrics breaking higher.
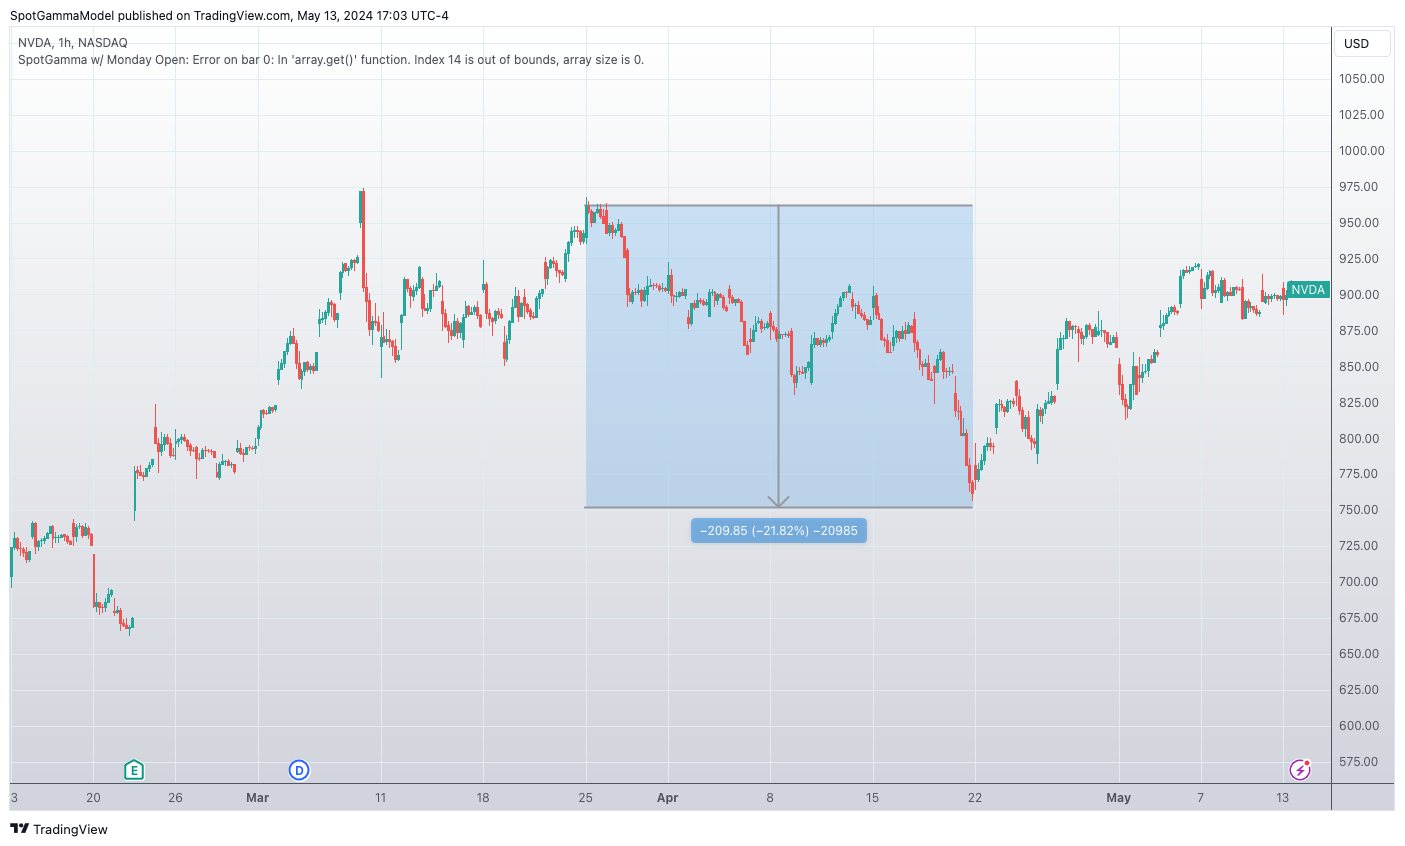
NVDA, and equities writ-large, have since recovered from those April lows. As mentioned, the stock-rebound has pushed correlation back near lows. This is a signal of traders pushing back into single stock names, with macro concerns fading away.
Additionally, implied volatility has been crushed. This can be seen via the VIX, which peaked on April 19th before coming down to recent lows in the last few days of trading.
We believe that the decline of IV invokes bullish dealer hedging flows – this is the “vanna” impact. Declines in IV asymmetrically reduce the value of put positions, which may allow options dealers to cover related short stock positions.
The fresh lows in IV also suggest there is a great deal of market calm heading into options expiration, displayed in the following VIX chart.
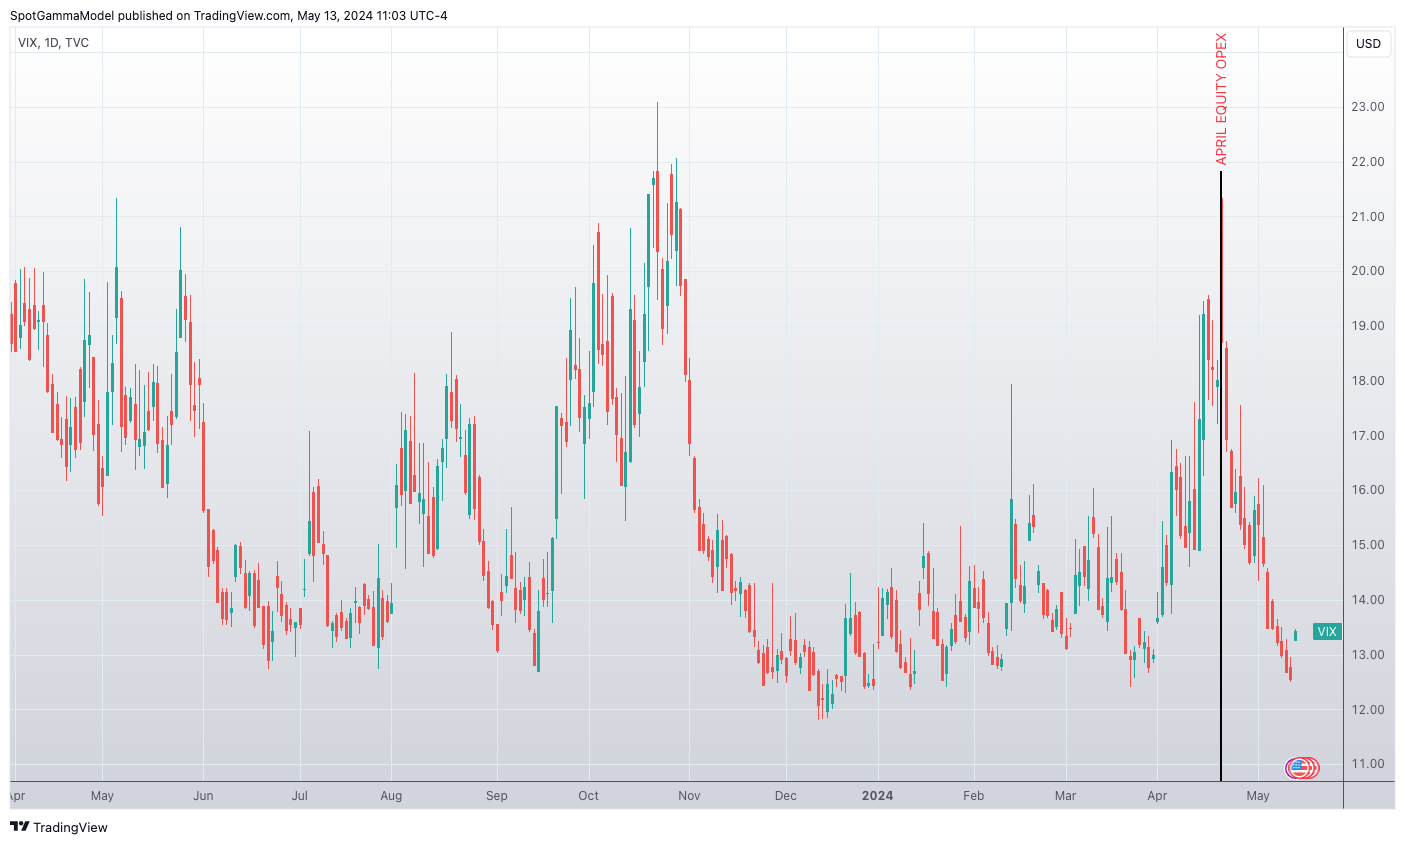
This market calm is on full display through more sophisticated IV measurements like SpotGamma’s term structure app, shown below for the SPX Index (which also highlights upcoming key market events).
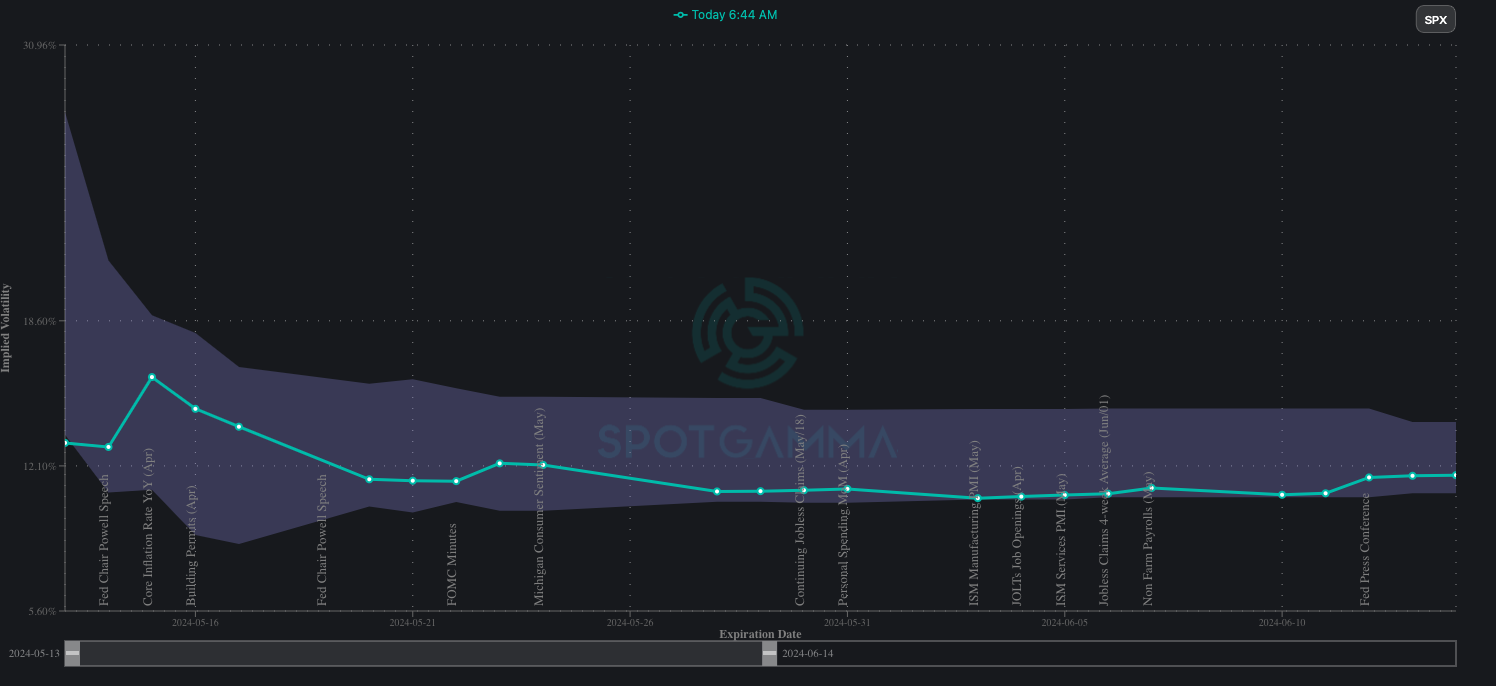
As you can see there is a small bump in IV for short dated expirations due to an upcoming 5/14 PPI, and 5/15 CPI prints. However, IV readings are at statistical lows out past this date, as denoted via the gray shaded cone. This informs us that traders have very low anxiety farther out in time.
This lack of anxiety appears not only in the equity complex but also across assets. Below is data from the CBOE showing that rates, credit, oil, and FX volatility have all returned to recent lows after spiking higher in April.
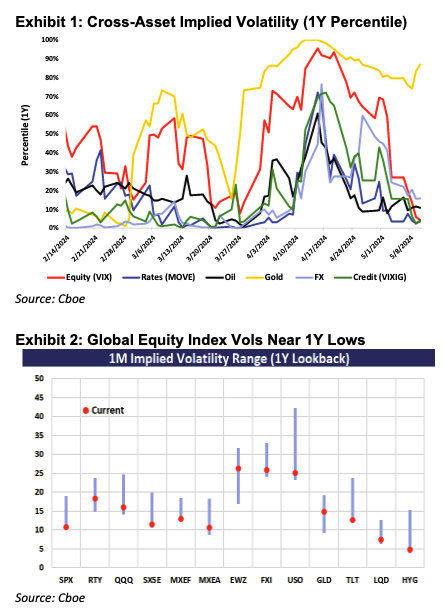
Therefore, while pundits may be focused heavily on the outcome of upcoming Fed speeches & PPI/CPI, volatility suggests traders have little concern.
Because IV is generally quite low, we think there is only a small vanna-boost to be offered by the passing of PPI/CPI. Accordingly, these events are dovish to neutral, and their passing likely results in the S&P500 moving to 5,300 by OPEX.
Attention would then turn to 5/22 NVDA earnings – a key upcoming event (more on that below).
Our “risk-off” level is a break <5,200 in the SPX index. Should these upcoming data points prove hawkish/bearish, a move <5,200 may lead to an extended decline <=5,100, and a surge in volatility measures, like the VIX (as shown below in the SPX chart displaying proprietary SpotGamma support and resistance lines).
What about NVDA?
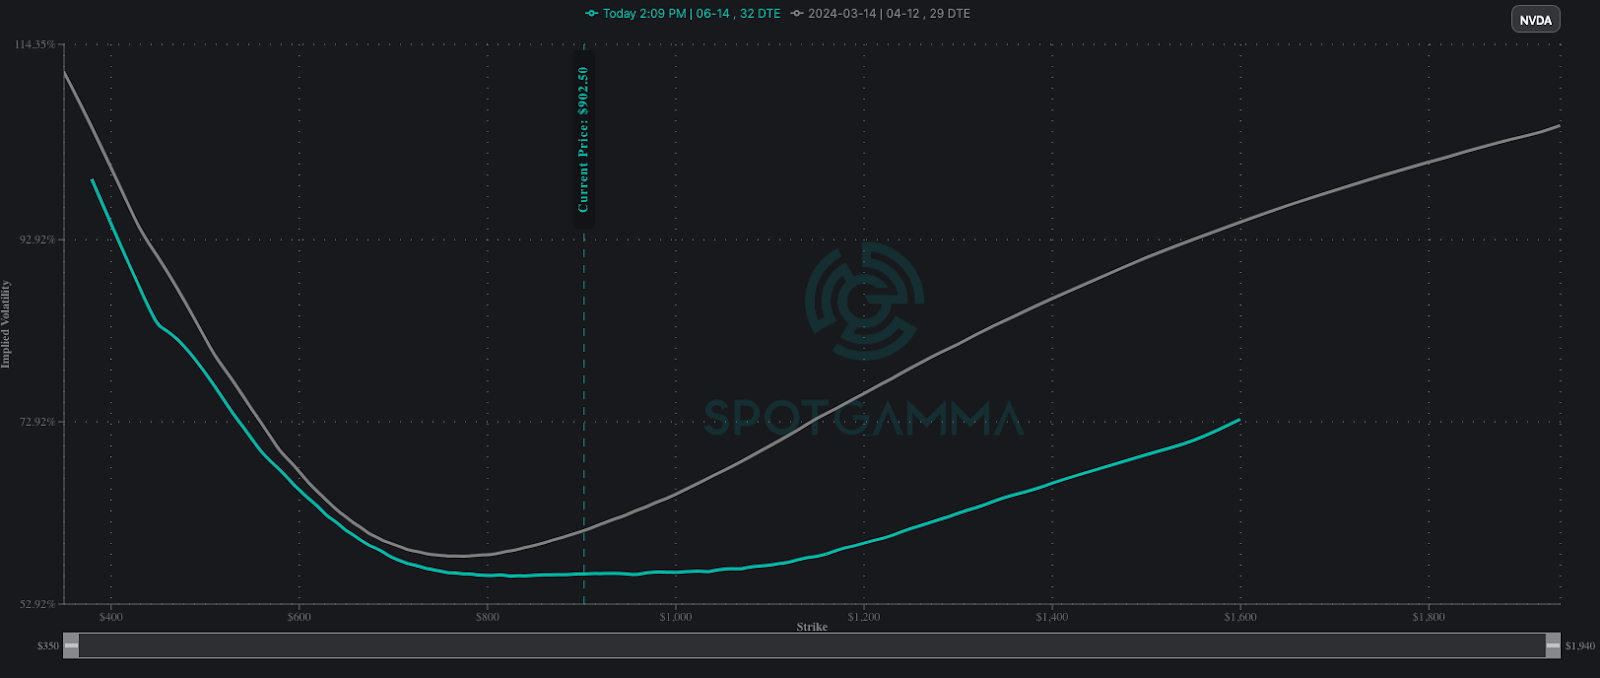
We wanted to close by discussing NVDA and its positioning heading into the upcoming earnings on 5/22. One of the characteristics of NVDA’s stock price into March was extremely high call skew driven by large call demand ahead of key events like earnings and their 3/18 Global Technology Conference.
At the peak of this bullish period, we discussed that call IV’s/skew were reaching very high levels, which reduced the probability that long call positions would be profitable – even if very good data came out of these events.
In other words: the calls were just too expensive in March and they are relatively less expensive here in June.
What we see now is a much lower call skew even though the stock is back near similar highs of the 3/18 GTC conference. This signals that there is currently less long call demand, implying that good earnings from NVIDIA could generate a strong rally in the stock.