The following is a guest post courtesy of Michael Kramer of Mott Capital Management.
The S&P 500 finished the week ending September 24 up a mere 50 basis points, a tranquil week – on the surface.
Volatility was fierce to start the week, a dynamic predicted by SpotGamma and shared with their subscribers last week. On Monday morning, the SpotGamma daily note highlighted the 2% range for the day with strong support at the Put Wall (4300 on the SPX), which served as the exact low of the week as the market bounced right off and jolted higher near the close.
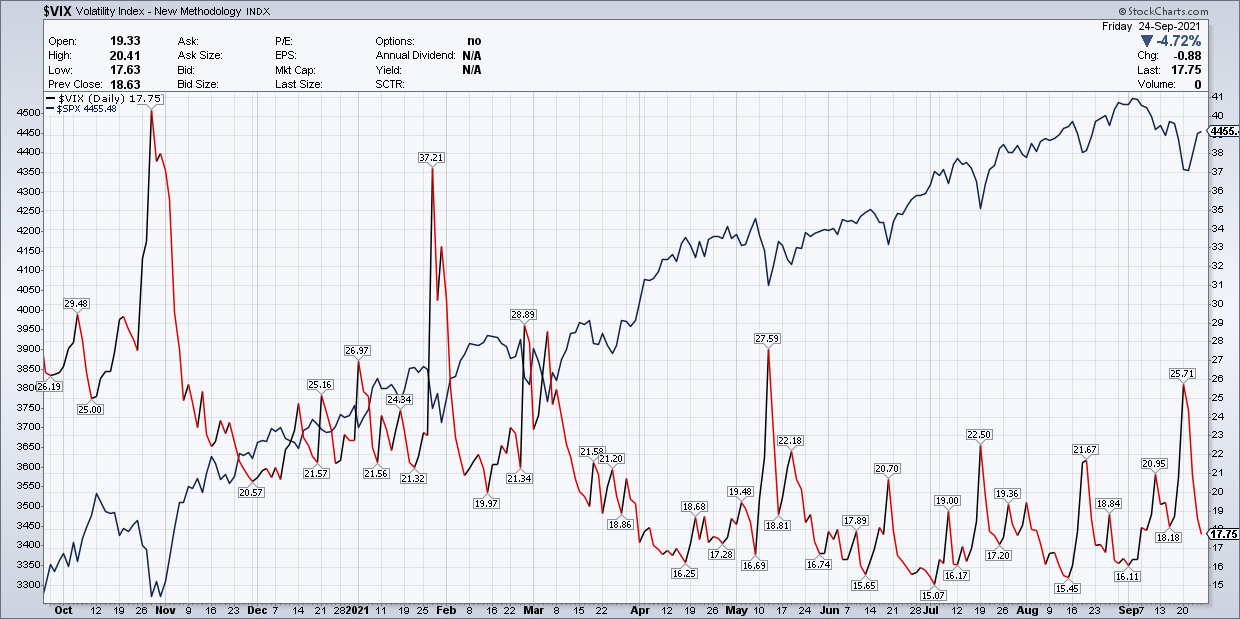
The decline was driven by increasing fears over the Chinese real-estate developer Evergrande, which left investors scrambling, sending the S&P 500 lower by 1.7%, with the VIX spiking nearly 24% to 25.7. It didn’t help that there was a great deal of uncertainty around an upcoming FOMC meeting later in the week.
It would seem that buying the dip in the S&P 500 worked once again. On a technical basis, the market’s health appears to be deteriorating, with the rally during the second half of the week nothing more than a volatility-driven illusion. In fact, it is entirely possible, the stock market is not out of the woods yet, and the declines aren’t over.
Dip Then Rip
The rise in volatility went as expected heading into the FOMC meeting. A post on September 9 noted the market had been anticipating higher volatility due to the uncertainty of the Fed meeting. The post highlights how Equity Hub suggested there could be a big sell-off in the market if the S&P 500 fell below 4,400.
It seems possible the snapback rally likely had nothing to do with the Fed decision or easing fears over Evergrande.
By all accounts, the FOMC meeting was much more hawkish than many had anticipated:
The Fed gave powerful signals a taper could start as early as November, while projecting more interest rate hikes than previously forecast at the June meeting.
Despite a more hawkish Fed, the market ripped.
The giant rip higher in the VIX set up the market’s massive rebound for the back half of the week. This has been a typical pattern that has taken place for more than a year. The crush lower in implied volatility sends the market soaring, which happened on Wednesday and Thursday. However, by Friday, the VIX had returned to much lower levels. Suddenly, the market lost all of its momentum.
This action was almost exactly how it was explained in a post by SpotGamma on September 7, “Reflexivity & The Weatherman.” The post details the reflexive nature of volatility and how it works much like a rubber ball:
With each bounce, the height to which the ball rises gets smaller. With volatility already low, the rally may stall completely, and what happens going forward may not be what many expect.
Weak Internal Metrics
The internal indicators tell a tale of an S&P 500 with a feeble 50% of its stocks trading above their 50-day moving average and 74% trading above the 200-day moving average. While the percentage of stocks above their 200-day moving average is a reasonably healthy level, this has been dropping precipitously since peaking in April.

It gets worse because the number of stocks making new highs within the index has also been steadily dropping since the beginning of September, with just 20 this past Friday. This compares with the number of stocks making new lows rising to 6, which sounds small, but that is the highest the count has been since October 29, 2020.
Meanwhile, the S&P 500 McClellan Summation Index is at 59. The reading has not been this low since September 2020, when the index was trading nearly 11% off its September 2, 2020 highs.

By all accounts, many of the market’s internals are much weaker than the index would seem, sitting just 2% off their early September 2, 2021 highs. When looking at some internal and technical metrics, one would think the market was down sharply.
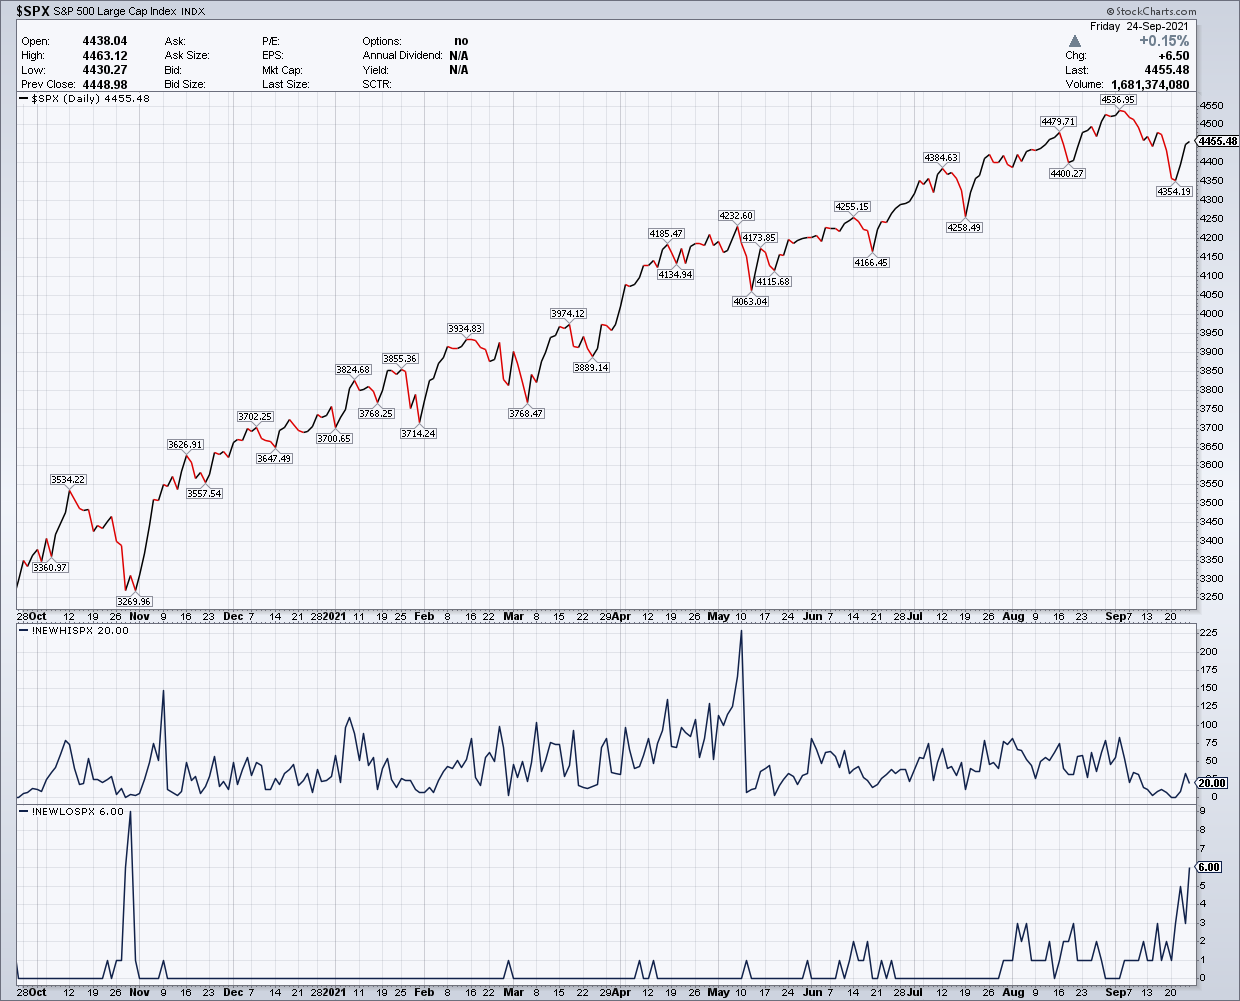
It could be the case that the dip was nothing more than a massive pump in implied volatility, and the rip was driven by an enormous collapse in implied volatility.
It would seem that until proven otherwise, that may be the case. If so, then the recent sell-off may soon resume, based on some of those weak technical metrics.