• Skip to main content
  • Skip to primary sidebar

SpotGamma™

S&P 500 Stock Market Gamma Trading Levels Based on Options Open Interest

  • About
  • Pricing
  • Academy
  • Resources
    • Tool Demos
    • Case Studies
    • Blog
    • Support Center
    • Free Daily Report
    • Free Trading Tools
      • Options Profit Calculator
      • SPX Gamma Exposure
      • Implied Earnings Moves
      • Volatility Ranking
    • Free Training
    • Report Card
  • Login

FOMC

Aug 27 2026

Jackson Hole 2026: What the Options Market Expects
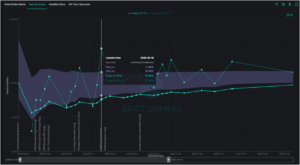
SPY forward IV prices Jackson Hole as a non-event, but CTAs are stretched short Treasuries and SPX gamma flips near 7780 — an asymmetric setup into Friday.

Written by SpotGamma · Categorized: Market Analysis · Tagged: bonds, FOMC, gamma, GLD, GOLD, interest rates, negative gamma, OPEX, SPX, TLT, volatility

Jun 21 2026

Vol Sellers Shrug off a Hawkish Fed

Despite a hawkish Fed rattling equities midweek, the market easily and quickly retraced any lost ground by Thursday. With June OPEX now behind us and implied volatility reset toward recent lows, there is a soft feeling of “what’s next?” for the S&P 500 until earnings season ramps up next month. The June FOMC meeting on […]

Written by Sherry An · Categorized: Market Analysis, SpotGamma Weekly · Tagged: dealer hedging, FOMC, Gamma Exposure, hawkish Fed, implied volatility, JPM Collar roll, Kevin Warsh Fed, market makers, Micron earnings implied move, negative gamma, OPEX, SPCX options, spotgamma weekly, SPX term structure

Jun 14 2026

Triple Witching + FOMC Fuels Volatility Risk
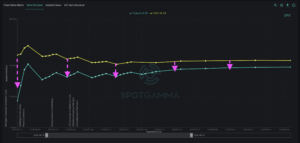
The market delivered several volatile sessions last week as traders navigated Wednesday’s CPI inflation report, Friday’s massive SpaceX IPO (SPCX), and a mix of Iran-driven headlines throughout. Last Sunday, we wrote about how extreme options positioning into major catalysts could spark the exact volatile market behavior observed over the past several days. Tuesday’s wild 200-point […]

Written by Sherry An · Categorized: Market Analysis, SpotGamma Weekly · Tagged: dealer hedging, FOMC, Gamma Exposure, gold GLD outlook, implied volatility, Kevin Warsh Fed, market makers, negative gamma, OPEX, spotgamma weekly, SPX term structure, triple witching

Apr 05 2026

How One Key Level Drove Last Week’s Rally
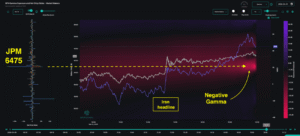
The S&P 500 bounced back 2% last week after scraping against 6-month lows. Mixed headlines on the Iran conflict explained much of this tug-of-war, yet markets are still holding their breath. For many traders, the rally felt counterintuitive: How can equities rally so furiously if geopolitical uncertainties remain unresolved? When looking at Tuesday’s major bounce in […]

Written by Simon Scholten · Categorized: Market Analysis, SpotGamma Weekly · Tagged: dealer gamma, dealer positioning, FOMC, geopolitical risk, implied vol, iv, JPM Collar, negative gamma, OPEX, put skew, realized vol, spotgamma weekly, SPX, trace, volatility

Mar 22 2026

After OPEX: Market Loses Its Shock Absorber
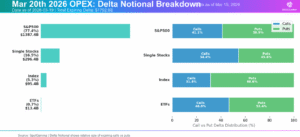
The options market has just cleared one of the largest structural events of the quarter, as Friday’s OPEX saw nearly $1.4 trillion in delta notional expire for the S&P 500. Because significant positions have now rolled off from the March expiration, the market has lost an important stabilizing force just as macro pressures begin to build. […]

Written by Simon Scholten · Categorized: Market Analysis, SpotGamma Weekly · Tagged: dealer gamma, dealer positioning, FOMC, geopolitical risk, implied vol, iv, negative gamma, OPEX, put skew, realized vol, spotgamma weekly, SPX, trace, VIX, volatility, Volatility Skew

Mar 15 2026

March OPEX: Tipping Point or Turning Point?
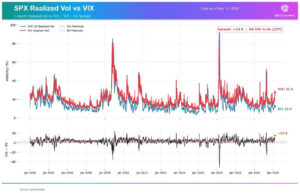
Fragility, Risk, and Potential Vol Reset As the S&P 500 enters OPEX week, we echo the same theme of the past few weeks: this market remains fragile. Last week’s selloff pushed the index below the three-month trading range of SPX 6,800-7,000 that had held since late 2025, subsequently closing down 5% since mid-January. The conflict with Iran continues […]

Written by Simon Scholten · Categorized: Market Analysis, SpotGamma Weekly · Tagged: dealer gamma, dealer positioning, FOMC, geopolitical risk, implied vol, iv, negative gamma, put skew, realized vol, spotgamma weekly, SPX, trace, VIX, volatility, Volatility Skew

Feb 15 2026

Flat Index Masks Hidden Chaos

Overall price stability in the S&P 500 is masking one of the most unusual equity environments in recent years. While SPX has been roughly flat over the past month, the average constituent has moved 10.8% — a 99th percentile dispersion reading, as we discussed in our Thursday AM Founder’s Note. All signs point to increasing fragmentation beneath […]

Written by Simon Scholten · Categorized: Market Analysis, SpotGamma Weekly · Tagged: FOMC, iv, OPEX, positive gamma, spotgamma weekly, SPX, VIX, volatility

Feb 08 2026

The Market’s 0DTE Underbelly Is Exposed

Last week reminded us just how fast market stability can give way to volatility. After trading near all-time highs at 7,000, the S&P 500 fell 3% in just three sessions, closing Thursday at 6,798 amid weakness in software and crypto. Our last Sunday Newsletter focused specifically on how this type of fragility underscores today’s market. This […]

Written by Simon Scholten · Categorized: Market Analysis, SpotGamma Weekly · Tagged: FOMC, iv, OPEX, positive gamma, spotgamma weekly, SPX, VIX, volatility

Feb 01 2026

SPX Touches 7,000 and Cracks — What Makes This Market So Fragile?

Market Fragility in the Face of All-Time Highs As the S&P 500 pushes record highs, the options market continues to flash warning signals beneath the surface. Underlying risk from volatility discrepancies and index-equity correlation suggest an environment prone to vol spasms — similar to what we witnessed with Thursday’s (1/29) sharp selloff and reversal. These […]

Written by Simon Scholten · Categorized: Market Analysis, SpotGamma Weekly · Tagged: FOMC, iv, OPEX, positive gamma, spotgamma weekly, SPX, VIX, volatility

Jan 25 2026

Vanna Fuels Market Rally as Market Fears Subside

Last week began with fear dominating market sentiment: analysts widely attributed Tuesday’s 2% SPX selloff to Greenland worries and tariff threats. As we pointed out in last weekend’s newsletter, traders had begun hedging against downside risk as put skew increased and volatility premiums rose. However, the quick turnaround back to SPX 6,900 seemed to erase any […]

Written by Simon Scholten · Categorized: Market Analysis, SpotGamma Weekly · Tagged: FOMC, iv, OPEX, positive gamma, spotgamma weekly, SPX, VIX, volatility

  • Go to page 1
  • Go to page 2
  • Go to page 3
  • Go to Next Page »

Primary Sidebar

SpotGamma-Subscriber-Signup-Banner

  • Software Earnings Reignite Risk Appetite
  • Jackson Hole 2026: What the Options Market Expects
  • One Stock, 803 ETFs: Why Nvidia Earnings Impacts the Entire S&P 500
  • NVDA Earnings: The Options Market May Be Underpricing This Move
  • Volatility Has Compressed. What Happens Next?
  • youtube
  • x
  • Privacy Policy
  • Disclaimer
  • Terms & Conditions
  • Support Center
  • Media
  • Contact Us

©2026 TenTen Capital LLC DBA SpotGamma

All SpotGamma materials, information, and presentations are for educational purposes only and should not be considered specific investment advice nor recommendations. Futures, foreign currency and options trading contains substantial risk and is not for every investor. An investor could potentially lose all or more than the initial investment. Risk capital is money that can be lost without jeopardizing one's financial security or lifestyle. Only risk capital should be used for trading and only those with sufficient risk capital should consider trading. Past performance is not necessarily indicative of future results. Testimonials appearing on this website may not be representative of other clients or customers and is not a guarantee of future performance or success.

View Full Risk Disclosure