The VVIX Index — officially the CBOE VIX Volatility Index — measures the expected volatility of the VIX itself over the next 30 days. Where the VIX reflects how much traders expect the S&P 500 to move, the VVIX reflects how much traders expect volatility itself to move.
It is, in the simplest terms, the volatility of volatility – A.K.A. “The VIX of the VIX”.
For traders, VVIX is not just a fear gauge — it is a signal about market structure:
Who is buying protection, how aggressively, and what that demand implies for forward price behavior in both SPY and VIX.
What Is the VVIX Index?
The VVIX is calculated by CBOE using the same methodology as the VIX, but instead of using S&P 500 options prices as inputs, it uses VIX options prices. The result is a real-time measure of implied volatility for the VIX — a 30-day forward-looking estimate of how violently the VIX itself could swing.
VIX = expected 30-day volatility of the S&P 500 (derived from SPX options)
VVIX = expected 30-day volatility of the VIX (derived from VIX options)
The VVIX was introduced by Cboe in 2012. Its long-run average sits near 85–95. Values above 100–110 signal elevated demand for VIX options — a market that is actively hedging against a volatility spike, not just watching for one.
VVIX vs. VIX: Why the Difference Matters
Most traders watch the VIX as their primary market stress indicator. The VVIX adds a second dimension: how uncertain traders are about volatility itself.
| VVIX Level | Market Interpretation |
| <80 | Very low vol-of-vol; VIX options cheap; complacency risk |
| 80-100 | Normal range; no unusual demand for VIX options |
| 100-120 | Elevated; traders buying VIX upside protection; watch for vol regime shift |
| >125 | High stress; options market pricing in significant VIX moves; dealers short gamma in VIX options |
A critical observation: VVIX and VIX frequently diverge.
When VVIX rises sharply but VIX stays flat, that divergence often signals that sophisticated traders are pre-positioning for a vol spike before spot volatility materializes. It is the institutional tell — demand for tail protection before the tail has arrived.
What VVIX Levels Mean in Practice
High VVIX levels imply that the price of VIX calls is increasing – its a sign of traders hedging large declines in the S&P500.
| VIX | VVIX | |
| Measures | Expected SPX Volatility | Expected VIX Volatility |
| Inputs | SPX Options Prices | VIX Options Prices |
| Long-run Average | 19-20 | 85-95 |
| Spikes During Stress | Yes | Yes, Often Earlier Than VIX |
| Directly Tradable | VIA options, futures & ETPs exist | No |
What the Data Shows: SPY and VIX Forward Returns by VVIX Level
To understand how VVIX levels actually translate into market outcomes, we analyzed historical forward returns for both SPY and VIX across the full range of VVIX readings.
First, we start with SPY forward returns. How do we trade off of the VVIX levels?
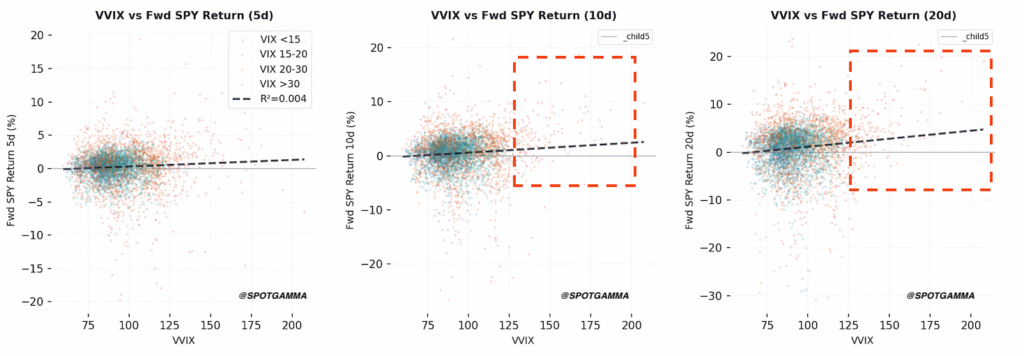
Below are the forward 5, 10 and 20 day returns for the S&P500 versus the VVIX Index.
Cutting to the chase, most of the relationship is simply noise – except what happens when the VVIX shifts >=125. We noted these areas in the forward 10 and 20 day SPY returns (red box), as those areas suggest when the VVIX is >125, the SPY sees strong positive returns!
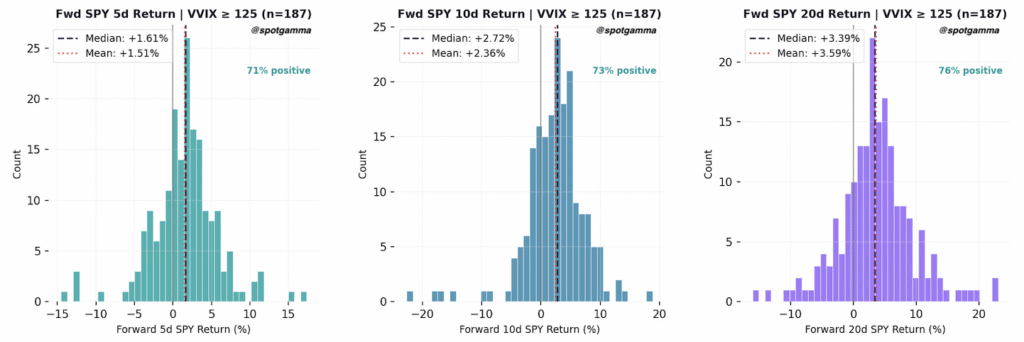
These data points are categorized in the histograms, below. These histograms show the forward SPY 5, 10 and 20 day returns from when the VVIX Index closed >=125. As you can see those SPY returns are positive +70% of the time, with mean and median SPY returns from 1.5 to 3.6%.
How does VVIX signal future volatility for the SPY?
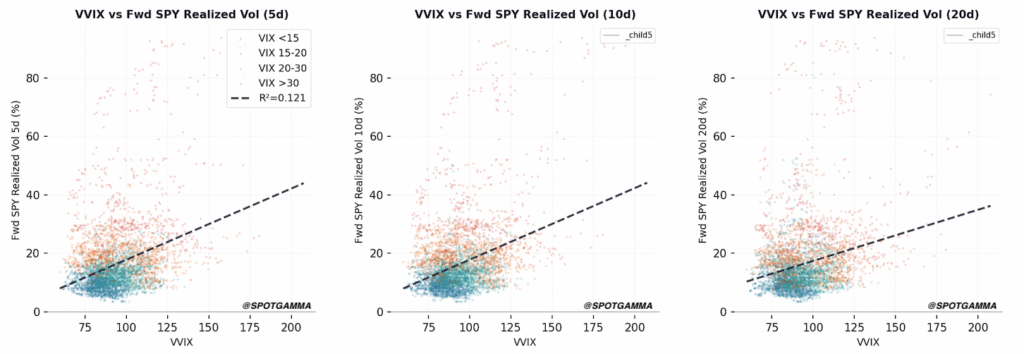
There is a clear relationship between the level of VVIX and the forward volatility for the SPY. Here we plotted SPY 5, 10 and 20 day realized volatility vs the VVIX. This relationship makes sense – an elevated VVIX suggests traders are hedging against higher volatility.
What is the relationship between the VVIX and how much the VIX changes in the future?
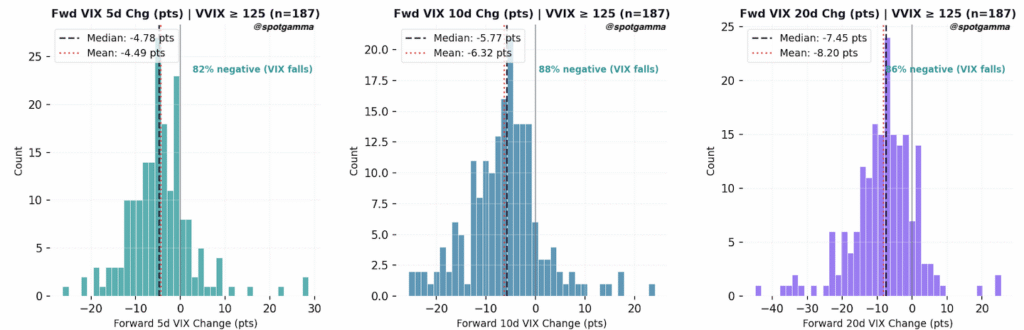
What we see is that when the VVIX is >=125, the VIX tends to decline – often sharply.
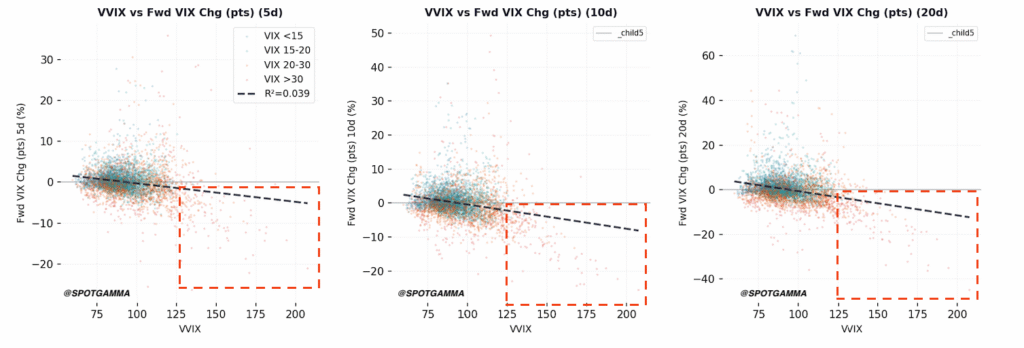
The histograms below show that the VIX falls +80% of the time after the VVIX index closes >=125. This suggests that short implied volatility strategies may work well into extremely high VVIX readings.
Three Ways Options Traders Use VVIX
1) Gauging Whether VIX Options Are Expensive or Cheap
VVIX is the implied volatility of VIX options. A high VVIX means VIX options are expensive — premiums are elevated because demand for VIX upside calls and puts is high. A low VVIX means the opposite: VIX options are relatively cheap.
Traders pricing VIX calls for portfolio hedges should always check VVIX — buying VIX calls when VVIX is at 130 means you are paying for a lot of embedded vol.
2) Identifying Pre-Positioning by Sophisticated Market Participants
Institutional traders who anticipate a vol event will often buy VIX calls before the VIX itself moves. This demand drives VVIX higher without necessarily moving the VIX. A rising VVIX against a flat or declining VIX is one of the more reliable early-warning signals in the options market — it indicates that someone is paying up for volatility protection.
3) Sizing Volatility Positions and Hedges
For traders running short volatility strategies — selling VIX spreads, SPX iron condors, or similar — VVIX is a critical position-sizing input. High VVIX environments mean the distribution of VIX outcomes is wide. The same short vol position that is appropriate when VVIX is 85 carries materially more tail risk when VVIX is 115.
VVIX and Market Structure: The SpotGamma Perspective
Standard VVIX commentary treats it as a sentiment indicator. At SpotGamma, we look at it through a market structure lens.
When VVIX rises sharply, it reflects real options order flow — traders are buying VIX calls and puts, increasing dealer short gamma exposure in the VIX options market. This has downstream effects:
- Dealers short VIX gamma must hedge dynamically — they buy VIX futures as VIX rises, selling as it falls, amplifying VIX moves in both directions
- High VVIX = dealers in a more reactive posture in vol markets, similar to how negative GEX amplifies SPX moves
- VVIX above ~110 in a rising VIX environment has historically coincided with the most violent vol acceleration episodes — because both spot and vol-of-vol dealers are hedging in the same direction simultaneously
This is why we track VVIX alongside GEX and VIX term structure in the data. Not as a standalone fear indicator — but as one signal in a broader picture of dealer positioning and flow.
Frequently Asked Questions About VVIX
What is a normal VVIX level?
The long-run average for the VVIX is approximately 85–95. Readings below 80 are historically low and can indicate complacency in the options market. Readings above 100–110 are elevated and suggest increased demand for VIX options. Readings above 150 are rare and associated with acute market stress events.
Can you trade the VVIX directly?
No. Like the VIX, the VVIX is a non-tradable index. There are no VVIX futures or ETPs. However, VVIX levels directly inform the pricing of VIX options — so it is a critical input for anyone trading VIX calls, puts, or spreads.
What does it mean when VVIX spikes but VIX stays flat?
A VVIX spike with a flat VIX is a divergence signal. It means traders are buying VIX options — paying for protection against a future vol spike — even though realized or implied S&P 500 volatility hasn’t moved yet. Historically, these divergences have often preceded VIX expansions within days to weeks.
Is a high VVIX bearish for stocks?
Not mechanically. High VVIX reflects uncertainty about future volatility, not a directional bet on equities. However, high VVIX environments do widen the distribution of SPY outcomes — returns are more likely to be extreme (in either direction). Our scatter plot data shows that extremely elevated VVIX readings have historically coincided with wide SPY return dispersion, not consistently negative returns.
How does VVIX relate to GEX (Gamma Exposure)?
Both VVIX and GEX are market structure signals — they measure dealer positioning and hedging flow, not just sentiment. Negative GEX in SPX combined with elevated VVIX creates the most volatile market environments: spot dealers and vol dealers are both in reactive hedging postures simultaneously, which amplifies moves in both price and volatility.
What happened to VVIX during the August 2024 volatility event?
During the August 5, 2024 volatility spike — triggered by the yen carry trade unwind — VVIX surged dramatically alongside VIX, which briefly touched 65. The VVIX had shown elevated readings in the days prior, with the VVIX/VIX divergence pattern visible before the event materialized in spot vol.
Where can I track VVIX in real time?
The Cboe publishes the VVIX in real time at cboe.com. SpotGamma’s Volatility Dashboard displays VVIX alongside VIX term structure, GEX, and dealer positioning data — providing the market structure context the raw index number alone does not.