The S&P 500 delivered a grinding week, closing at 6,584 on Friday and up 1.3% from Monday’s open of 6,498. The 6,505 JPM Collar call acted as a critical pivot, where previous resistance turned into support.
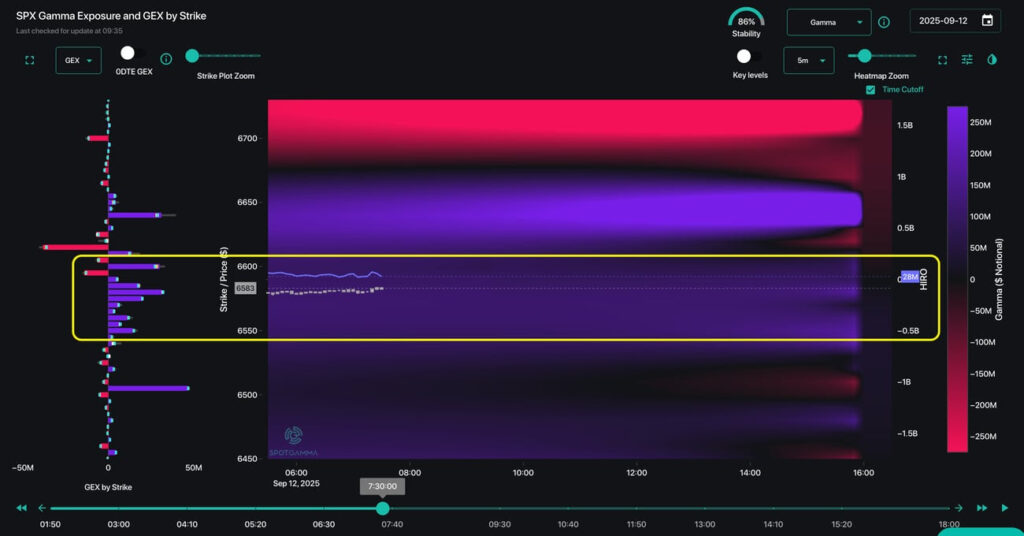
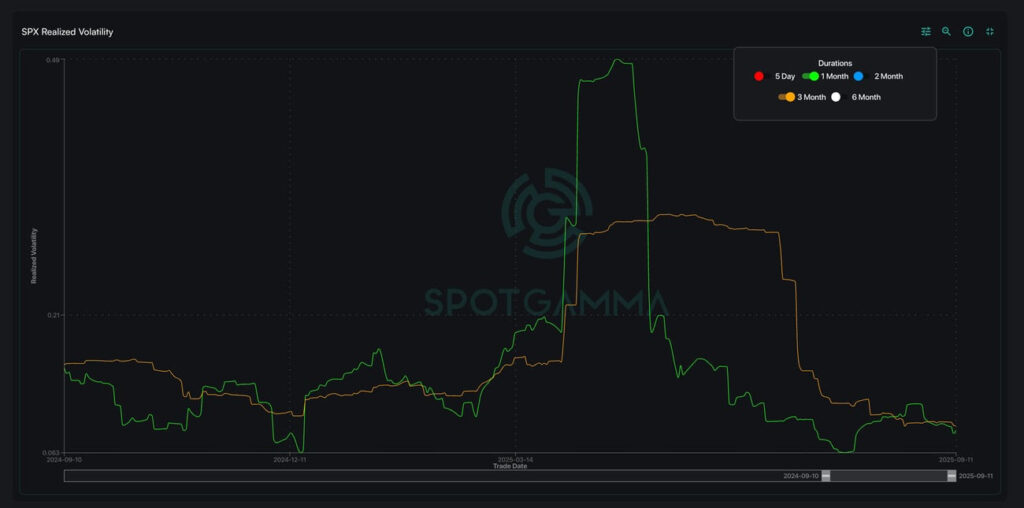
We shared our zombie market thesis in our Founder’s Note on Monday morning: current positive dealer gamma – driven by extremely short-dated options – explains the volatility suppression we have witnessed, with 1-month SPX realized vol compressing from 10% to nearly 8% over the past few weeks.
As an example from Friday, our TRACE indicator showed heavy positive gamma blanketing the SPX 6,550 – 6,600 price range, primarily driven by 0DTE flow.
The impact is clear when zooming out to view the steep decline in realized vol over the past year: 3-month RV (yellow) is at it’s lowest point in over a year.
As we have repeatedly emphasized, these extremely short-dated trades have effectively placed bounds on market movement: 0DTE options-selling forces dealers to hedge by buying underlying stock as price drops and selling underlying stock as price rallies. This dampening effect explains the drop in realized volatility as the market achieves all-time highs.
The risk that remains is that 0DTE sentiment might shift away from the current low-vol expectation, effectively removing this market mechanism for keeping volatility suppressed. Were these flows to fluctuate too dramatically, we are left with neutral-to-negative gamma for the S&P 500, opening the risk of amplified price action and the return of volatility.
Week Ahead: VIX Expiration, FOMC, and Triple Witching
Monday’s SPX ATM IV reading of just 5% represents extreme vol compression. With VIX expiration and FOMC converging Wednesday (9/17), we expect this to mark a floor for implied volatility.
Moreover, Friday’s Triple Witching OPEX (9/19) presents a significant market event given the unprecedented scale of options positioning: nearly $1.1 trillion in SPX delta notional expires that day – an enormous concentration that will require substantial adjustments to dealer hedges.
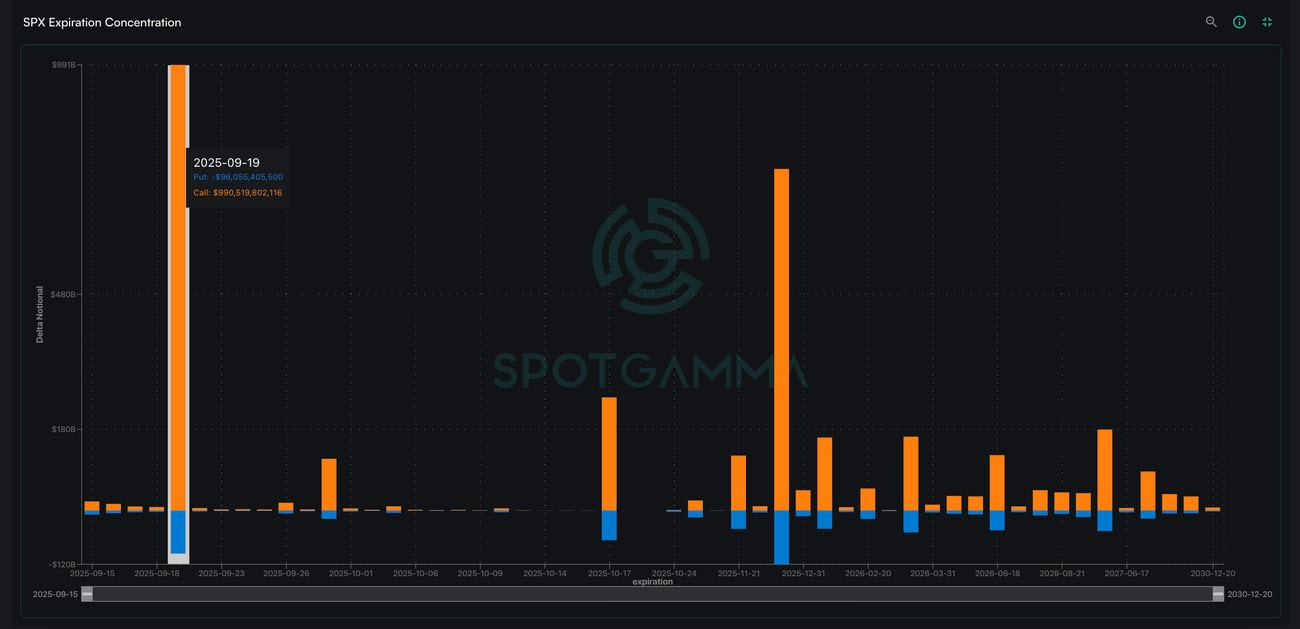
This OPEX in particular presents a concerningly call-heavy expiration with an 11:1 ratio of calls to puts (based on delta notional value). The combination of a massive expiration immediately following FOMC could create significant flow-driven volatility.
The current dealer gamma structure suggests a break below 6,500 next week could trigger negative gamma territory, where dealer hedging flows would begin to amplify price action and open the doors to heightened volatility.
ORCL’s 40% Move and Structural Mispricing
Oracle’s rally of nearly 40% post-earnings exemplifies how options pricing can fail to properly account for event volatility. Ahead of earnings, ORCL had an options-implied move of just 8% – meaning the options market had completely mispriced tail risk.
Interestingly, ORCL had virtually no call open interest above $325 before September 9, creating a gamma desert where dealer hedging flows become negligible, and making the stock more vulnerable to extreme moves.
On September 10, when traders started taking profits and selling more than $230 million calls (based on our FlowPatrol report below), the stock reversed the following two sessions.
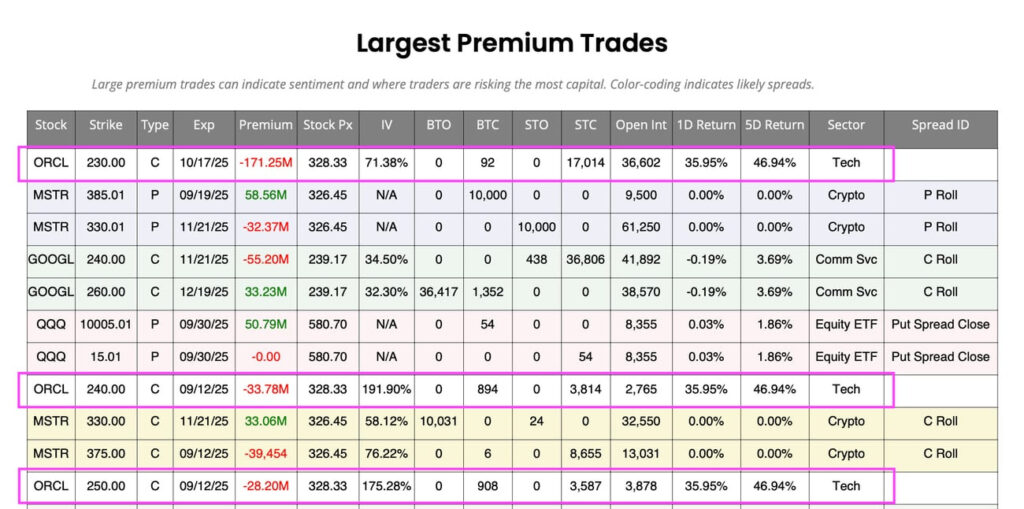
Traders profited from the eventual fade by selling call spreads or implementing call fly structures. Without continuing options-driven support flows, momentum names often struggle to maintain extreme moves.