Macro Theme: |
Key Levels: |
| > Major resistance: $4,065 (SPX Large Gamma) > Pivot Level: $4,000 > Major Support: $3,950 > Critical support: $3,900 (SPX Put Wall) > Key Dates: 2/1 FOMC > Major risk lies on a break of 4000, as dealers may flip to negative gamma hedging | Ref Price: 4060 SG Implied 1-Day Move: 1.08% SG Implied 5-Day Move: 2.86% Volatility Trigger: 4020 Absolute Gamma Strike: 4000 Call Wall: 4100 Put Wall: 3900 |
Daily Note:
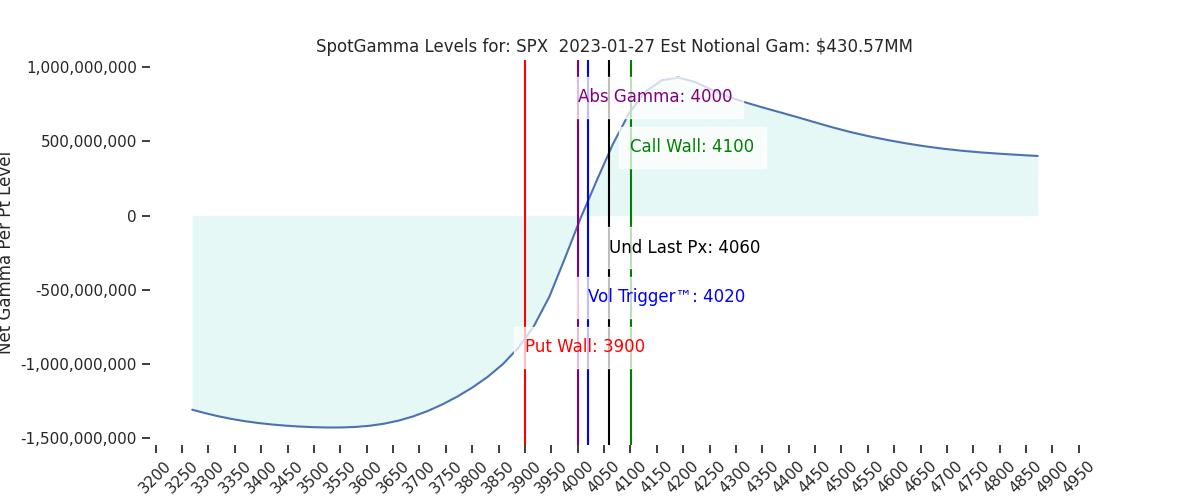
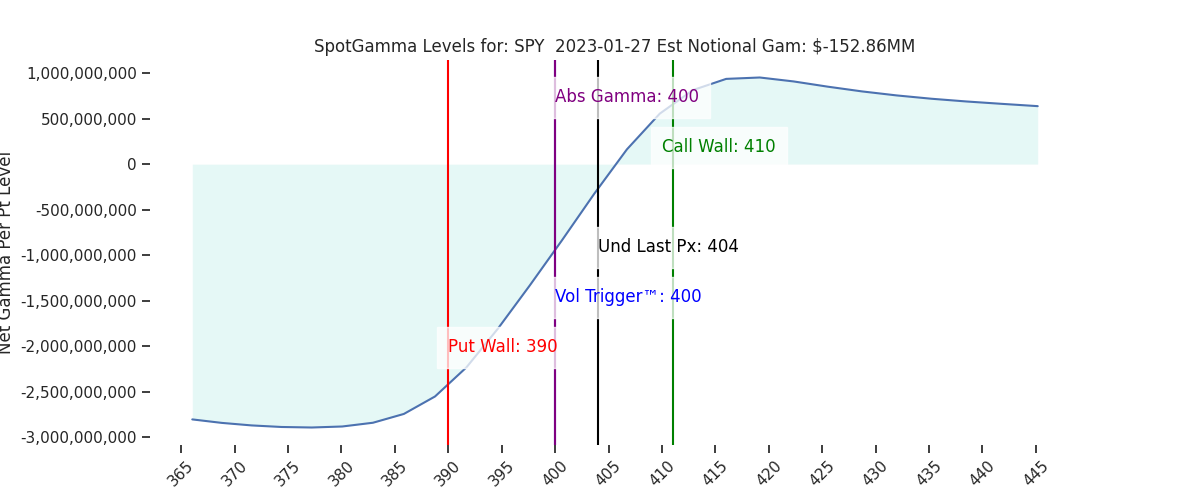
Futures were quiet overnight, holding 4065. The SPX Call Wall has shifted up to 4100, which is now the top of our range, and syncs with the 410 SPY Call Wall. The closer area of large resistance continues to be at 4050 – 4065 (SPY 405). Support lies at 4015 (SPY 400) & 4000 SPX. We do currently see a large support level under 4000 until 3900.
There are a few data points out which may trigger short term volatility: 8:30 PCE & 10AM UMich + home sales.
The two big strikes yesterday were 400SPY/4000SPX on the put side, and 405/4050 on the call side. This is leading to the 4050-4100 area filling in with call strikes which we believe is creating more resistance in the form of positive gamma.
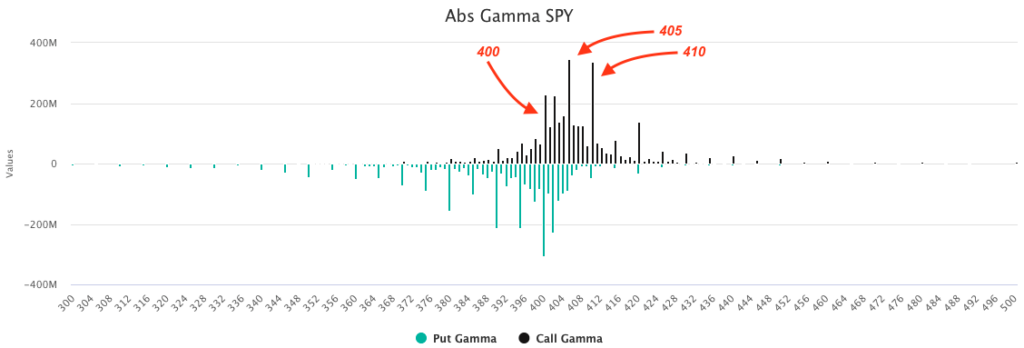
A few days ago we expressed that we felt the 4050-4065 (SPY 405) area would be the top into FOMC, and while we still feel that way, our models don’t signal an overbought condition unless we break 4100-4115(SPY410).
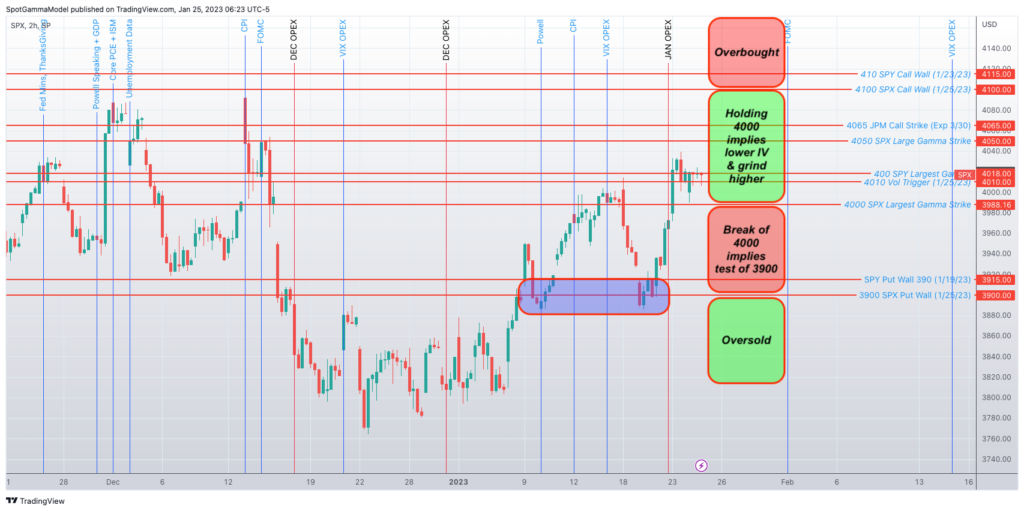
In that same note (from 1/25) we posted the market map from below, which remains in play today. To the downside we don’t pick up a large support level in the 3900’s, however we did break that level on Wednesday only to see large 0DTE volume come in to support markets near 3950 (note here).
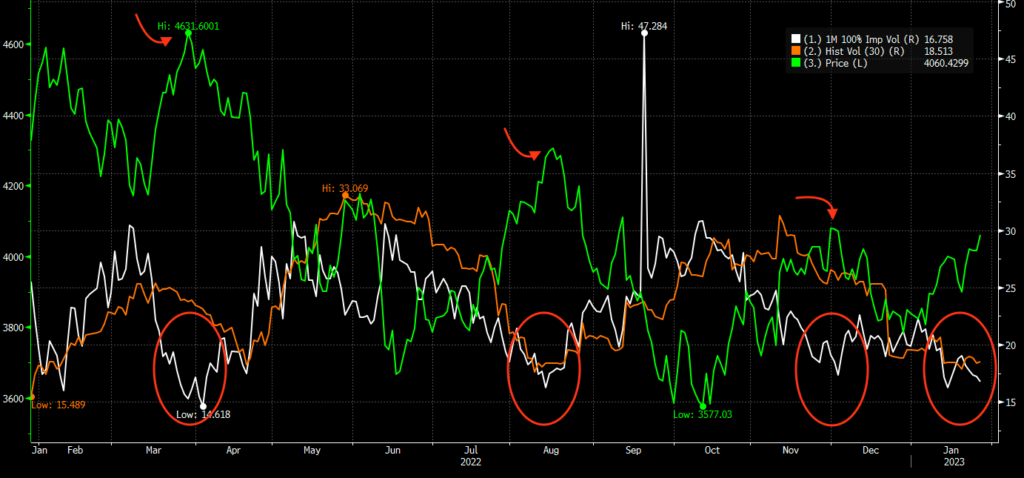
The other overarching theme here is lack of downside demand, and a slide lower in implied volatility. On this chart is the SPX (green), 30 day RV (orange) and 1 month IV (white). As you can see in the lower right we have IV sliding down near 1 year highs just as we head into 2/1 FOMC. The is signaling that the market is pricing volatility going forward, which likely requires friendly guidance from the Fed.
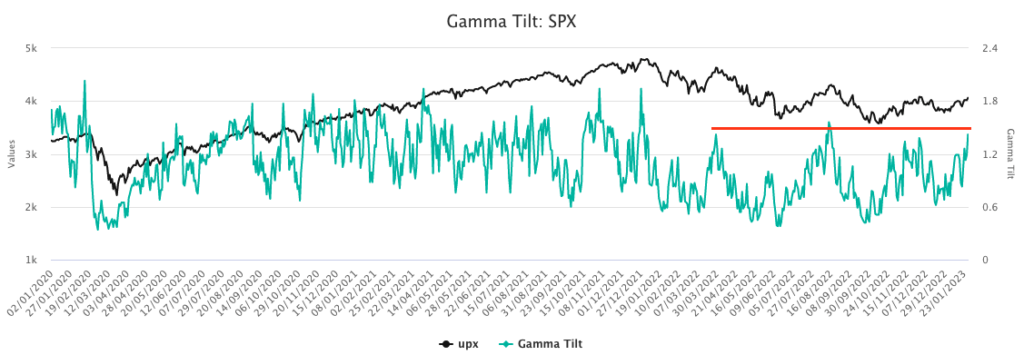
We discussed the ramifications of this in detail here, but essentially the risk here is that the market debate (and positioning) seems to be around Powell’s “shade of dovishness” and upside risk. Traders do no seemed hedge for any type of hawkish tilt.
While we do not have a view on the FOMC, the market clearly seems to be ready to accept a change in policy regime. Many of indicators are at 2022 extremes (like IV lows above), or the gamma tilt, below. This is not to say that the market doesn’t get what it wants – but we would prefer getting long post-Powell on a breakout rather than front-running the catalyst.
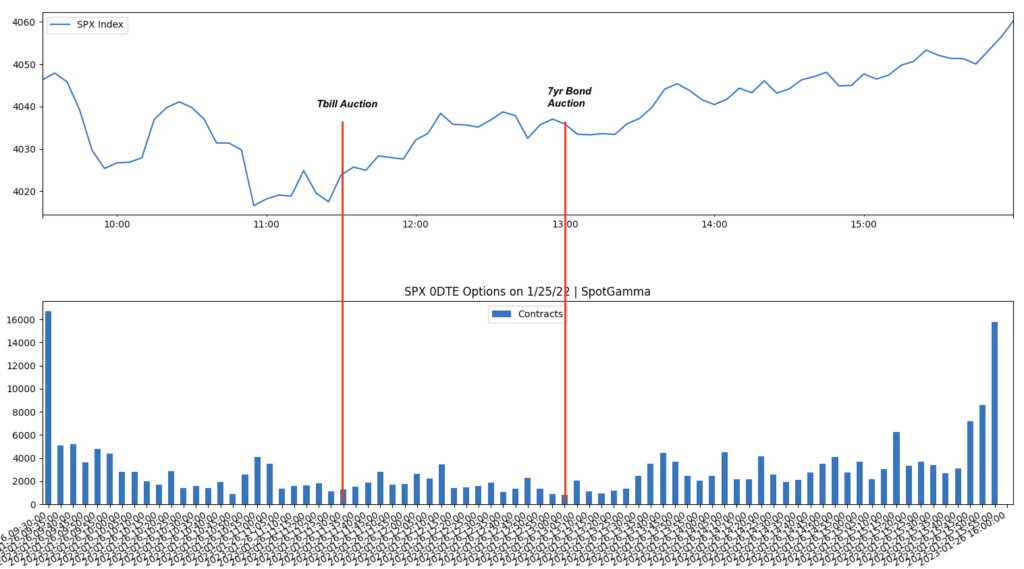
Finally we wanted to share the 0DTE vs treasury auction(s) data from yesterday as it received a lot of attention. Shown below is the SPX (top) vs 0DTE contract volume (bottom) and you can that a case could be made for an increase in 0DTE volume after the 1pm auction (right red line), but its not quite as clear cut as yesterday. We will certainly continue to monitor this.
| SpotGamma Proprietary SPX Levels | Latest Data | SPX Previous | SPY | NDX | QQQ |
|---|---|---|---|---|---|
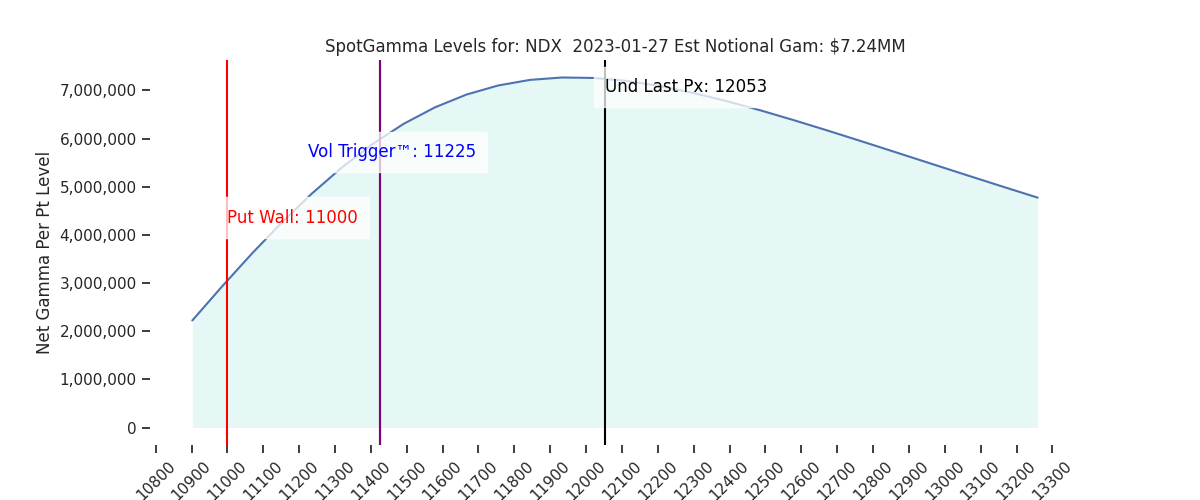
| Ref Price: | 4060 | 4047 | 404 | 12053 | 293 |
| SG Implied 1-Day Move:: | 1.08%, | (±pts): 44.0 | VIX 1 Day Impl. Move:1.18% | ||
| SG Implied 5-Day Move: | 2.86% | 3971 (Monday Ref Price) | Range: 3858.0 | 4085.0 | ||
| SpotGamma Gamma Index™: | 1.29 | 0.66 | 0.02 | 0.05 | 0.04 |
| Volatility Trigger™: | 4020 | 3970 | 400 | 11225 | 288 |
| SpotGamma Absolute Gamma Strike: | 4000 | 4000 | 400 | 11425 | 295 |
| Gamma Notional(MM): | 431.0 | 442.0 | -153.0 | 7.0 | 105.0 |
| Put Wall: | 3900 | 3900 | 390 | 11000 | 270 |
| Call Wall : | 4100 | 4050 | 410 | 11425 | 295 |
| Additional Key Levels | Latest Data | Previous | SPY | NDX | QQQ |
|---|---|---|---|---|---|
| Zero Gamma Level: | 4021 | 3984 | 404.0 | 0 | 305 |
| CP Gam Tilt: | 1.42 | 1.28 | 0.96 | 1.79 | 1.07 |
| Delta Neutral Px: | 3966 | ||||
| Net Delta(MM): | $1,425,132 | $1,450,825 | $166,159 | $52,654 | $83,280 |
| 25D Risk Reversal | -0.05 | -0.05 | -0.04 | -0.05 | -0.05 |
| Call Volume | 602,249 | 509,671 | 2,741,715 | 12,795 | 929,252 |
| Put Volume | 846,003 | 868,193 | 3,332,655 | 7,066 | 1,189,328 |
| Call Open Interest | 5,442,991 | 5,470,181 | 6,110,060 | 57,952 | 4,115,714 |
| Put Open Interest | 10,129,755 | 9,952,705 | 12,646,413 | 55,438 | 7,088,148 |
| Key Support & Resistance Strikes: |
|---|
| SPX: [4100, 4050, 4000, 3900] |
| SPY: [410, 405, 402, 400] |
| QQQ: [295, 292, 290, 280] |
| NDX:[13000, 12000, 11500, 11425] |
| SPX Combo (strike, %ile): [(4251.0, 86.9), (4227.0, 81.25), (4198.0, 95.6), (4174.0, 89.26), (4150.0, 96.53), (4125.0, 90.67), (4113.0, 91.11), (4109.0, 82.18), (4101.0, 99.25), (4089.0, 75.81), (4085.0, 89.93), (4081.0, 83.06), (4076.0, 96.45), (4068.0, 80.02), (4064.0, 96.47), (4060.0, 83.07), (4048.0, 97.14), (4032.0, 82.75), (4024.0, 87.43), (3963.0, 75.73), (3951.0, 79.53), (3914.0, 80.35), (3898.0, 91.48)] |
| SPY Combo: [408.75, 403.49, 413.6, 405.1, 406.32] |
| NDX Combo: [12126.0, 12331.0, 12078.0, 12006.0, 11511.0] |
| ©TenTen Capital LLC d.b.a. SpotGamma Please leave us a review: Click Here |
| See the FAQ for more information on reading the SpotGamma graph. |
| SpotGamma provides this information for research purposes only. It is not investment advice. SpotGamma is not qualified to provide investment advice, nor does it guarantee the accuracy of the information provided. This email is intended solely for subscribers, please do not distribute the information without the express written consent of SpotGamma.com. |