Costco reports Thursday, September 24, after the close, giving investors a timely consumer check during a quieter earnings week.
The key question: Are shoppers spending confidently, or turning to Costco to stretch tighter budgets?
Costco can benefit under either scenario. But the answer matters for the rest of retail: gaining customers who are hunting for savings is different from a broad improvement in spending.
Options currently price a roughly 3.6% move in either direction through Friday. COST earnings reports tend to be lower volatility but can paint a clearer picture for the retail sector and consumer spending overall.
Costco’s next-day closing move stayed within the published options-implied range in 6 of its past 8 earnings reports. The average implied move was 3.53%, versus an average actual move of 2.43%, regardless of direction. Interestingly, the two occurrences of the implied move being exceeded both came on downside moves.
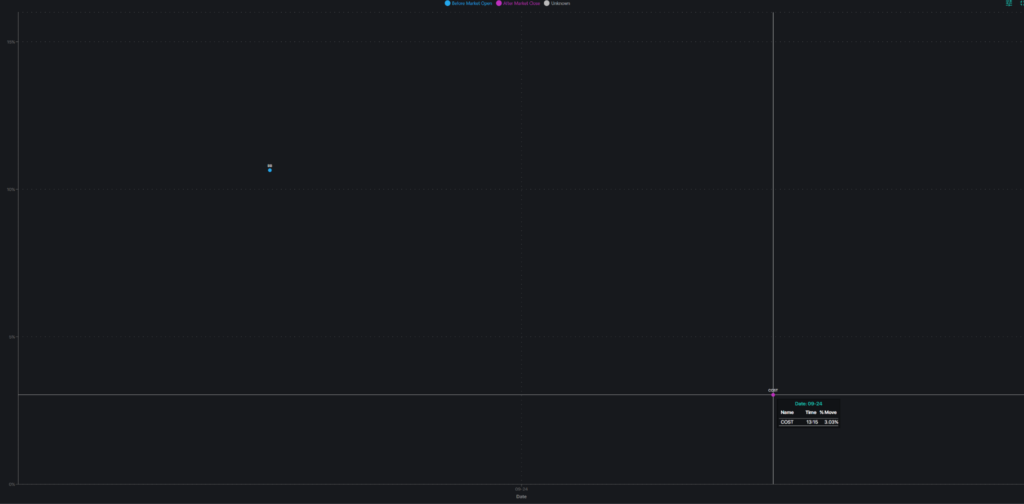
SpotGamma earnings calendar is quieter this week but Costco earnings on 9/24 is the main report.
| Earnings release | Implied move before report¹ | Actual next-day move | Exceeded implied range? |
|---|---|---|---|
| Sept. 26, 2024 | ±3.81% | −1.75% | No |
| Dec. 12, 2024 | ±3.24% | +0.10% | No |
| March 6, 2025 | ±4.19% | −6.07% | Yes |
| May 29, 2025 | ±3.29% | +3.12% | No |
| Sept. 25, 2025 | ±3.64% | −2.90% | No |
| Dec. 11, 2025 | ±3.43% | ≈0.00% | No |
| March 5, 2026 | ±3.41% | +1.58% | No |
| May 28, 2026 | ±3.22% | −3.91% | Yes |
What matters in the report
The sales headline is already out. Fourth-quarter net sales rose 11.3% to $93.9 billion, while comparable sales increased 6.7% excluding gasoline-price and currency effects. Investors will now focus on how much of that growth translated into profits.
Three details will tell the story:
- Membership: Are renewal rates holding up, and is Costco attracting new paying members?
- Shopping habits: Are customers buying discretionary items such as electronics and furniture, or concentrating on essentials?
- Margins: Can Costco keep prices competitive while covering higher freight, labor, and other costs?
Wall Street’s adjusted earnings estimate was around $6.55 per share in a September 16 preview. A beat would help, but the quality of earnings and management’s consumer commentary deserve equal attention. (Source: Barron’s)
Why gasoline matters
Regular gasoline averaged approximately $4.48 a gallon on September 21, up from $3.18 a year earlier. That leaves households with less money for optional purchases. (Source: AAA)
Costco’s fuel business makes it a particularly useful barometer. Competitive pump prices can attract shoppers, while higher gasoline prices mechanically lift reported sales, but Costco’s 6.7% Q4 comparable-sales growth excluding gasoline-price and currency effects shows the underlying business remained strong.
Investors should therefore watch traffic, fuel volumes, and purchases inside the warehouse—not just revenue growth.
For the broader sector, strong discretionary purchases would support confidence in the consumer. Growth concentrated in groceries and fuel would suggest shoppers remain cautious, potentially favoring value-focused retailers over discretionary chains.
What options are pricing
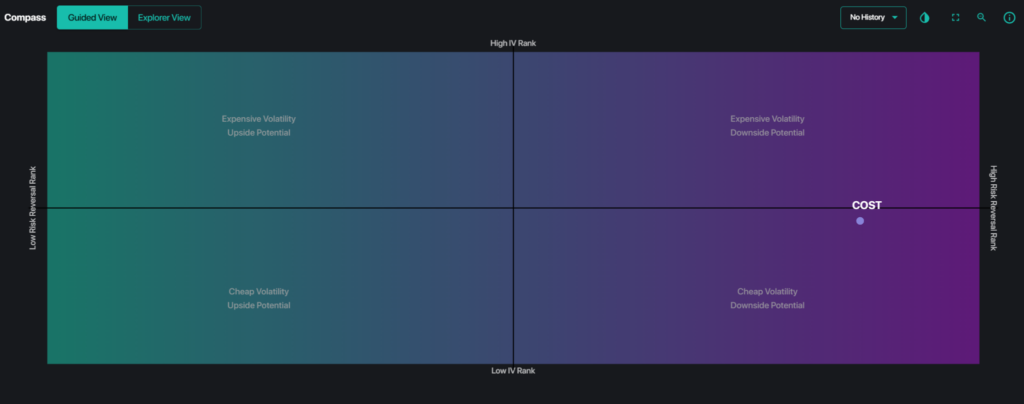
SpotGamma Compass map shows COST near mid range IV rank while also a higher risk reversal ranking implying downside potential if the report is a miss.
As checked September 21, options markets estimated a ±3.56% move through the September 25 expiration. That measures the size of the potential move, not its direction, and is no hard limit: Costco fell approximately 3.9% the day after its May earnings report. The Compass view below shows COST with a IV rank of 48%. Mid range over the past year from an implied volatility rank perspective.
For option buyers, getting the direction right may not be enough. Implied volatility often drops after earnings, reducing option premiums. A modest stock rally can still leave a call buyer with a loss.
COST is showing a solid amount of positive gamma in place via the SpotGamma synthetic OI model below. This condition supports its common trend of seeing a muted move post earnings as premiums evaporate. Interestingly, COST also sits right above its 900 gamma put wall currently into the print. This makes $900 an important positioning level to watch.
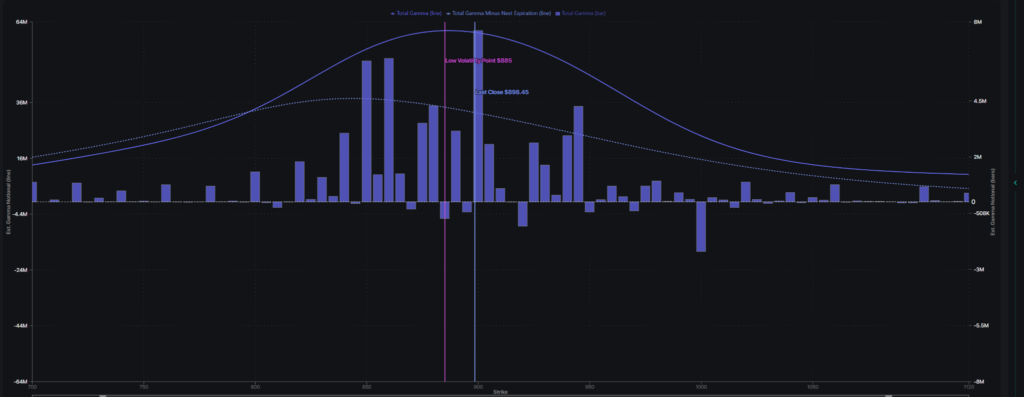
SpotGamma synthetic OI map shows a bell curve look to its gamma profile with positive gamma a key feature going into earnings. This implies stability in the stock.
Wildcard: Capital Return
A surprise capital-return announcement could complicate bearish positioning. Analyst commentary has focused particularly on the possibility of another special dividend; a stock split is also conceivable given COST’s share price, but there has been no indication from the company that one is imminent.
The bullish case is resilient spending, healthy membership growth, and solid margins. The risk is that fuel inflation flattens sales while shoppers pull back elsewhere. Watch what customers are buying—and what Costco earns on those purchases—to judge both the stock and the wider consumer picture.
COST historically realizes less earnings volatility than options price, positive gamma suggests relatively stable positioning, and $900 is an important nearby level—but the rare implied-move breaches have both occurred to the downside.
Formulating a Potential Trade Idea
COST options are not the most liquid but with the IV rank mid range and the stock price back near short term support at 900 it sets up a potential bull put spread trade where a trader may define risk while making a directional assumption that a floor may be in.
The October $885/$875 put credit spread is pricing at $3.70 and if sold would offer a breakeven level near $881.30 with 3 weeks til expiration. This ensures duration on the trade and not needing to be right on the stock move the day following the print.