• Skip to main content
  • Skip to primary sidebar

SpotGamma™

S&P 500 Stock Market Gamma Trading Levels Based on Options Open Interest

  • About
  • Pricing
  • Academy
  • Resources
    • Tool Demos
    • Case Studies
    • Blog
    • Support Center
    • Free Daily Report
    • Free Trading Tools
      • Options Profit Calculator
      • SPX Gamma Exposure
      • Implied Earnings Moves
      • Volatility Ranking
    • Free Training
    • Report Card
  • Login

May 20 2021

‘Gamma Tilt’ Suggests More Downside In Stocks As “Bigly” Op-Ex Looms

From ZH:

BY TYLER DURDENTHURSDAY, MAY 20, 2021 – 11:15 AM

Nomura’s Charlie McElligott summarized things heading into the weekend perfectly for traders: “Op-Ex tomorow matters ‘bigly’ for Equities.“

Critically, he explains, there remains likelihood of continued “chase-y” moves in both directions on dealer delta hedging due to the magnitude of the positioning out there:

  • Latest estimates show 31% of $Gamma set to drop-off in SPX / SPY consolidated options after Friday, but far more notably with 50% in QQQ and 55% in IWM ready to roll-off post Op-Ex.
  • SPX largest $Gamma strike is 4100 ($4.1B), and from there it’s the 4050 strike ($3.0B) to the downside and 4200 ($2.8B) and 4150 ($2.5B) to the upside.
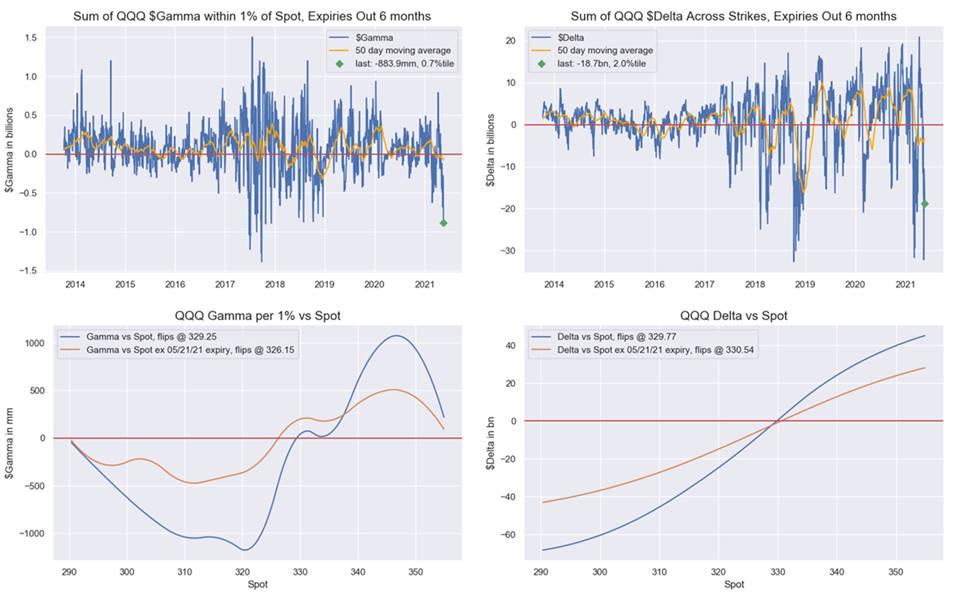
  • Currently versus spot, we see SPX “short gamma (4175 flip),LONG delta (4096 flip)”; QQQ “short gamma ($326.25 flip), short delta ($329.77 flip)”; and IWM, “short gamma ($224.22 flip), short delta (224.66 flip)”.
  • Again, the most extreme reads are in legacy “duration-sensitives” macro-regime of “secular growth” Nasdaq / QQQ, where (negative) $Gamma of -$884mm is 0.7%ile since 2013, and where (negative) $Delta is -$18.7B / 2.0%ile since ‘13.

Nasdaq remains the most extremely positioned…
Given the extreme levels of delta/gamma and opex-rolloff, SpotGamma warns that there are essentially two levers we are watching here:

  1. Because all indices are in a negative gamma position, that implies put gamma is in control. If markets start off quietly, then put decay may spark and keep a bid in markets as dealers cover shorts (this decay is charm).
  2. VIX/implied volatility(IV) is high. If VIX/IV breaks down then that will cause more rapid decay in puts, adding to a market tailwind. Conversely if VIX/IV spikes then dealers need to short futures (this is vanna).

If selling doesn’t materialize rather quickly today then this put decay vanna/charm combo could lead to a rally as dealer short hedges. We’d look at any rally as a function of “short covering” vs real buying which could lead to an air pocket into next week. We also note that next week is post-OPEX and so the window opens for more sustained volatility.

Below we’ve posted our “Gamma Tilt” metric. We don’t talk about this too often, but occasionally it catches our eye as it has done now. What we measure here is the ratio of call gamma: put gamma, and what you can see is that has dropped sharply.
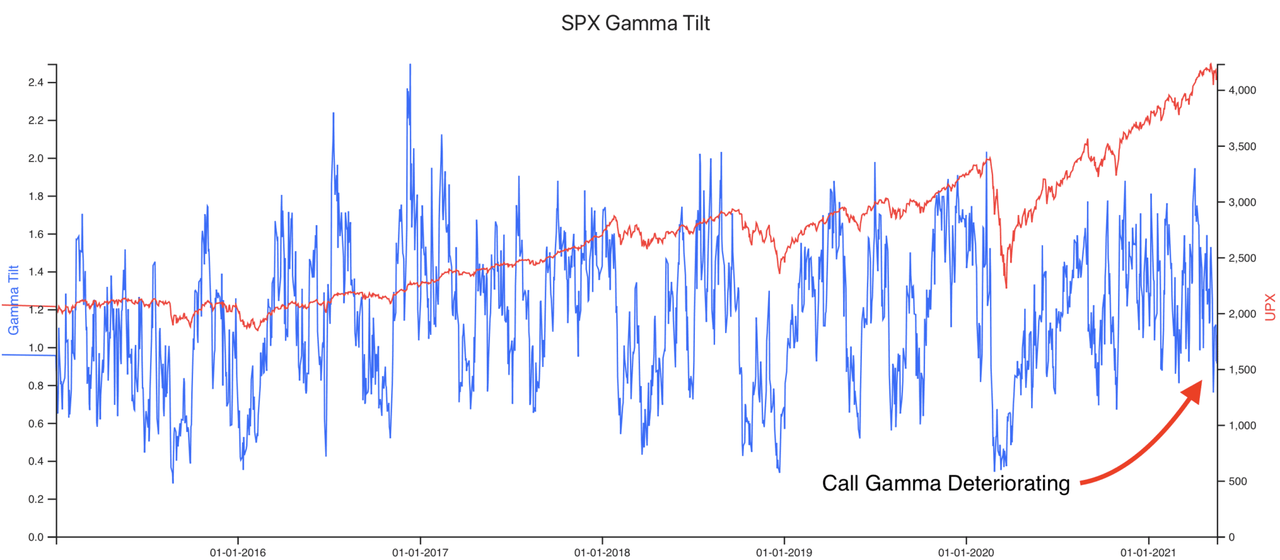
Quantitatively we have not found a consistent signal from this metric. Qualitatively when that ratio drops with stocks at all time highs it seems to foreshadow market drawdowns. Essentially what the ratio is saying now is that “call positions have declined substantially versus puts”. That is an odd thing to see with stocks within a few percent of all time highs.

Share This Article

  • Share
  • Twitter
  • LinkedIn
  • Reddit
  • Facebook

Written by developer · Categorized: Market Analysis · Tagged: mcelligott, nomura, OPEX

Don’t have an account with SpotGamma?

Choose the plan you want today to view unique support and resistance levels, access Founder’s Notes and expert commentary, daily trading ranges, and entrance into our private Discord.


Primary Sidebar

Related Resources

  • Options Exchange Monitor — Week of August 15, 2026 (36 SEC notices, 2 CFTC, 0 EDGAR)

    Options Exchange Monitor — Week of August 15, 2026 (36 SEC notices, 2 CFTC, 0 EDGAR)

    August 17, 2026
  • GEX Levels for SPY, QQQ, ES and NQ: Using Index Gamma in Any Product

    GEX Levels for SPY, QQQ, ES and NQ: Using Index Gamma in Any Product

    August 17, 2026
  • How to Trade GEX Levels: A Practical Guide to Gamma-Based Trading

    How to Trade GEX Levels: A Practical Guide to Gamma-Based Trading

    August 17, 2026
  • Free GEX Levels, Charts, and Data: What’s Available and What It’s Actually Worth

    Free GEX Levels, Charts, and Data: What’s Available and What It’s Actually Worth

    August 17, 2026
  • Covered Calls After Assignment: What to Do When the Stock Drops Below Your Cost Basis

    Covered Calls After Assignment: What to Do When the Stock Drops Below Your Cost Basis

    August 17, 2026
  • youtube
  • x
  • Privacy Policy
  • Disclaimer
  • Terms & Conditions
  • Support Center
  • Media
  • Contact Us

©2026 TenTen Capital LLC DBA SpotGamma

All SpotGamma materials, information, and presentations are for educational purposes only and should not be considered specific investment advice nor recommendations. Futures, foreign currency and options trading contains substantial risk and is not for every investor. An investor could potentially lose all or more than the initial investment. Risk capital is money that can be lost without jeopardizing one's financial security or lifestyle. Only risk capital should be used for trading and only those with sufficient risk capital should consider trading. Past performance is not necessarily indicative of future results. Testimonials appearing on this website may not be representative of other clients or customers and is not a guarantee of future performance or success.

View Full Risk Disclosure