• Skip to main content
  • Skip to primary sidebar

SpotGamma™

S&P 500 Stock Market Gamma Trading Levels Based on Options Open Interest

  • About
  • Pricing
  • Academy
  • Resources
    • Tool Demos
    • Case Studies
    • Blog
    • Support Center
    • Daily Report
    • Free Trading Tools
      • Opening Setup Free Report
      • Options Profit Calculator
      • SPX Gamma Exposure
      • Implied Earnings Moves
    • Free Training
    • Report Card
  • Login

Aug 20 2019

Nomuras Analyst Jumping the Gamma Gun

Nomura published an updated gamma chart showing that options dealers are now “Long Gamma…likely insulating price-action”. Nomuras options gamma estimate of 0 at 2923 is essentially the same level as our “Volatility Trigger” which is 2920. The issue with their analysis is that appears to be jumping the gun. Zero and positive are not the same thing. See below for more.
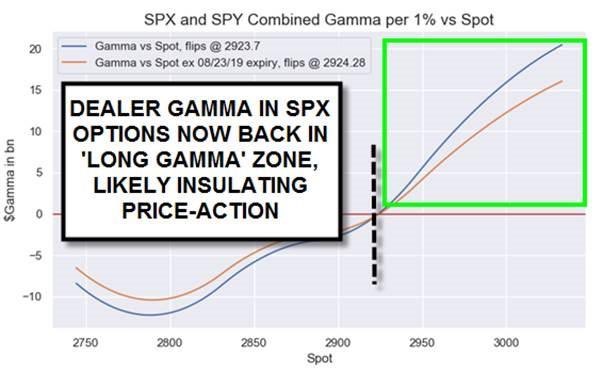
Nomuras Gamma Model and Long Gamma call.

At 0 gamma dealers have no volume to trade. 10 or so SPX points below here and dealers are back to short gamma which means they are likely “price escalating” aka selling futures as the market sells off. This expands volatility. This chart below gives an estimate of what futures trading by market makers might look like given a move in the S&P500. You can see that selling kicks in pretty quickly as we move down.
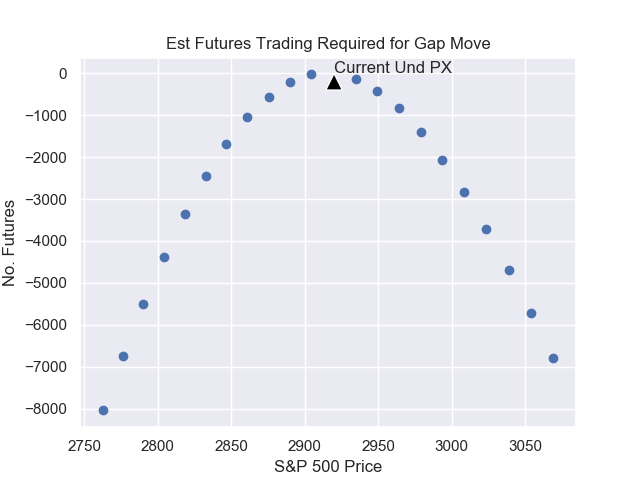
SpotGamma futures estimate based on dealer gamma in S&P500 options.

Therefore it appears that Nomuras options gamma estimate has a bullish narrative, rather than just supplying data.

Share This Article

  • Share
  • Twitter
  • LinkedIn
  • Reddit
  • Facebook

Written by SpotGamma · Categorized: Market Analysis · Tagged: futures, gamma, nomura, open interest, options

Don’t have an account with SpotGamma?

Choose the plan you want today to view unique support and resistance levels, access Founder’s Notes and expert commentary, daily trading ranges, and entrance into our private Discord.


Primary Sidebar

Related Resources

  • Tech Selloff Looks Like Rotation: Brent Kochuba on Schwab Network

    Tech Selloff Looks Like Rotation: Brent Kochuba on Schwab Network

    October 22, 2026
  • META Earnings Preview: Will Volatility Outrun the Options Market?

    META Earnings Preview: Will Volatility Outrun the Options Market?

    October 21, 2026
  • Traders Are Bidding The Put Wing Without Paying For Vol: Brent Kochuba On tastylive

    Traders Are Bidding The Put Wing Without Paying For Vol: Brent Kochuba On tastylive

    October 21, 2026
  • Tesla & SpaceX Earnings Preview: Two Reports, One Merger Question — What Are Options Pricing?

    Tesla & SpaceX Earnings Preview: Two Reports, One Merger Question — What Are Options Pricing?

    October 20, 2026
  • Tech Dip, Not Broad Equity Selling: Brent Kochuba On tastylive

    Tech Dip, Not Broad Equity Selling: Brent Kochuba On tastylive

    October 19, 2026
  • youtube
  • x
  • Privacy Policy
  • Disclaimer
  • Terms & Conditions
  • Support Center
  • Media
  • Contact Us

©2026 TenTen Capital LLC DBA SpotGamma

All SpotGamma materials, information, and presentations are for educational purposes only and should not be considered specific investment advice nor recommendations. Futures, foreign currency and options trading contains substantial risk and is not for every investor. An investor could potentially lose all or more than the initial investment. Risk capital is money that can be lost without jeopardizing one's financial security or lifestyle. Only risk capital should be used for trading and only those with sufficient risk capital should consider trading. Past performance is not necessarily indicative of future results. Testimonials appearing on this website may not be representative of other clients or customers and is not a guarantee of future performance or success.

View Full Risk Disclosure