• Skip to main content
  • Skip to primary sidebar

SpotGamma™

S&P 500 Stock Market Gamma Trading Levels Based on Options Open Interest

  • About
  • Pricing
  • Academy
  • Resources
    • Tool Demos
    • Case Studies
    • Blog
    • Support Center
    • Free Daily Report
    • Free Trading Tools
      • Options Profit Calculator
      • SPX Gamma Exposure
      • Implied Earnings Moves
      • Volatility Ranking
    • Free Training
    • Report Card
  • Login

May 31 2021

AMC Gamma Squeeze in Review

“Gamma Squeeze” was grabbing headlines again this past week after AMC and GameStop (GME) both surged in price. While GME returned +22% for the week, it was AMC that had blow-out returns of +103% and we think much of this price action was driven by a call options gamma squeeze.
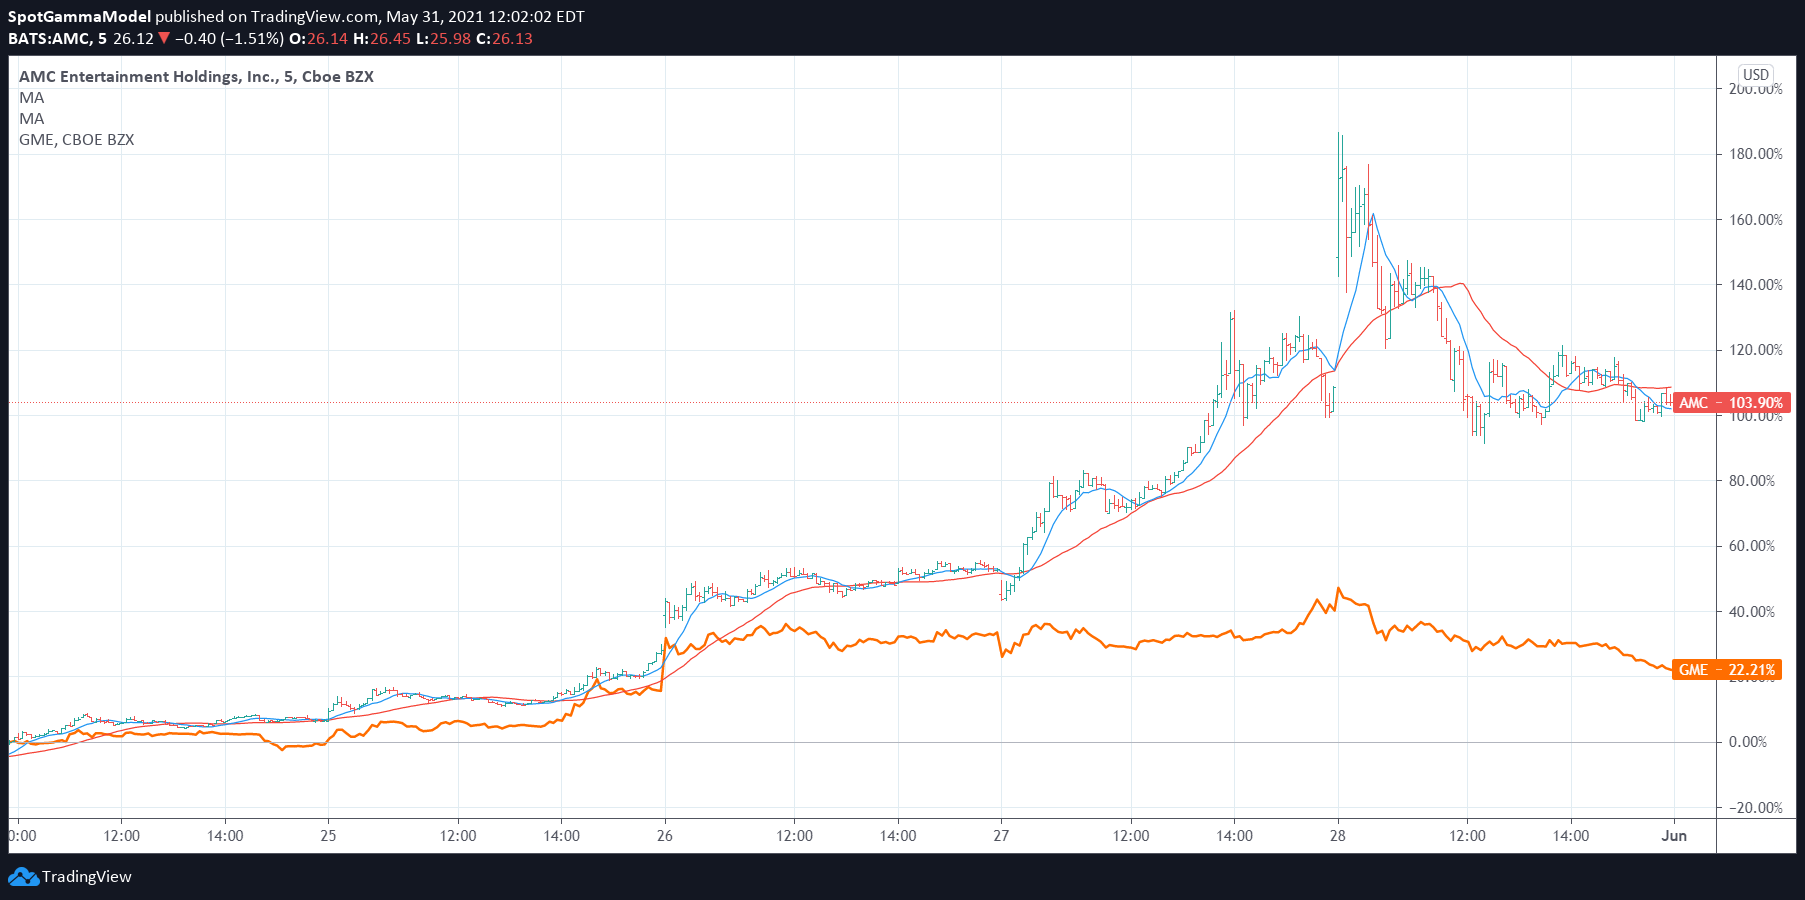
AMC GME stock price chart

The graph below lays out options volume and open interest changes for AMC. You can see that daily call volumes (dark blue) were up nearly 500% over the week, and it was not until Thursday or Friday that put volumes picked up. This surge in call volumes can lead to options market makers (MM) having to purchase shares of stock, which can drive the stock price higher.
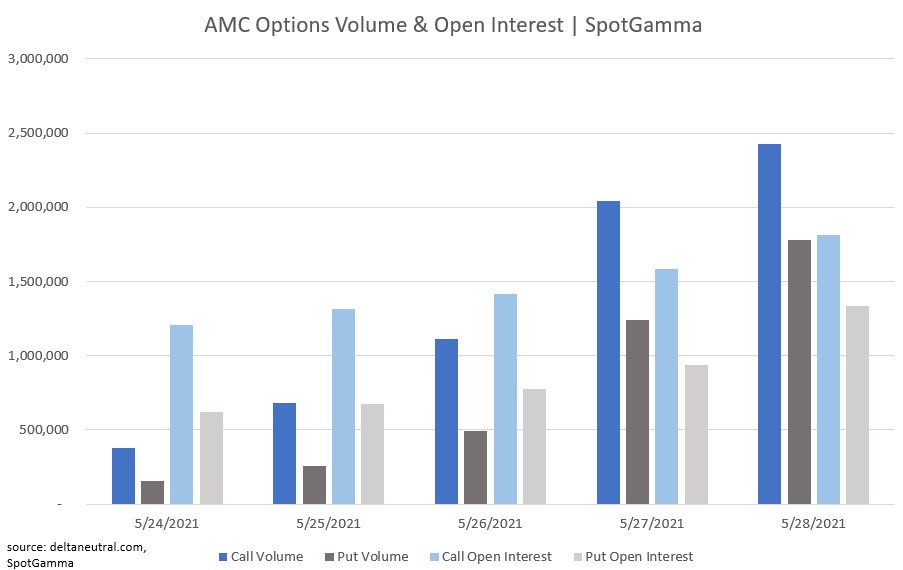
AMC options volume and open interest

To place this call activity in context, the table below shows the largest volume stocks/ETF’s for the week of 5/24. As you can see, AMC’s total volume is only second to the massive SPY ETF. Also, for perspective, note that AMC’s call volume is nearly double that of TSLA, which is the 3rd largest ticker by volume.
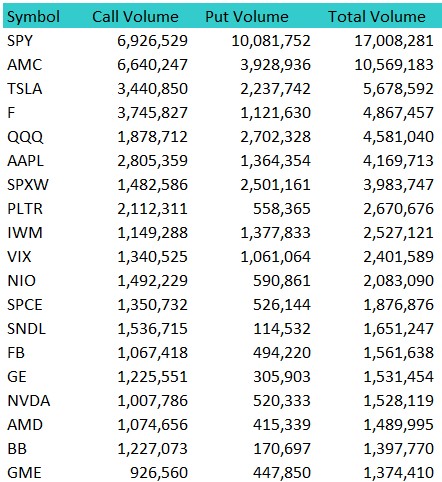
Top Options Volume for  The week of May 24th 2021

To have a “gamma squeeze” there first needs to be a “delta squeeze”. When new options positions are traded, MM may need to immediately hedge the risk generated by these new trades. This initial hedge is called a “delta hedge” and can result in large amounts of stock being purchased. As the stock price moves around, MM may need to adjust their hedge positions, which is called a “gamma hedge”.

What you can see below is the estimated delta hedge requirement (blue bars) that resulted from AMC options volume. In theory large increases in delta mean that large amounts of call options have traded, and MM need to buy shares of AMC. Note that as the delta increases in size it appears that the stock price (black line) rises higher, too.
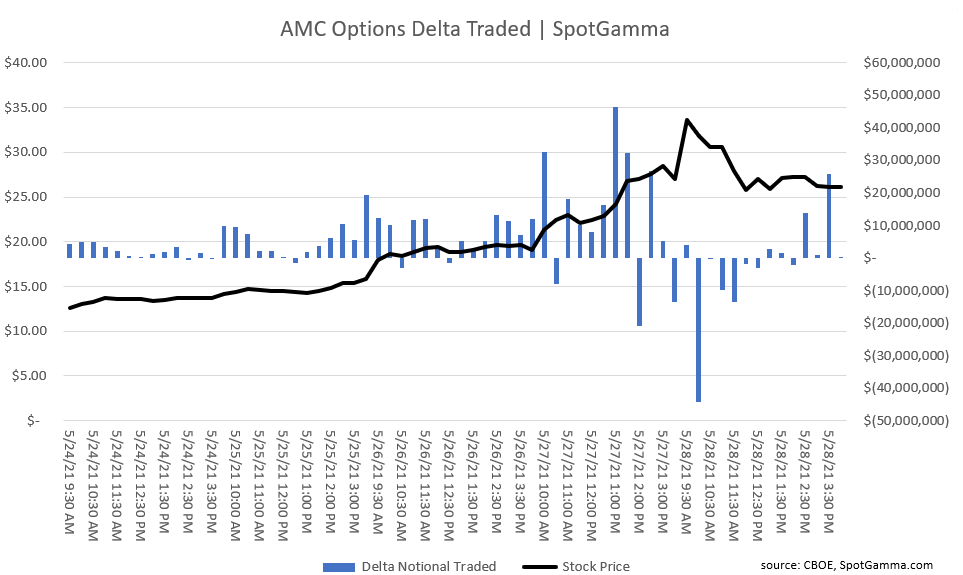
AMC Options Gamma Squeeze Delta Traded May 24th 2021

The “delta hedge” simply addresses new options trades, however its likely that MM have a substantial existing call position. Therefore as the stock rises, MM need to buy more shares of AMC to stay hedged on their existing position. This hedge adjustment is where “gamma” and the gamma squeeze comes into play. As new call buyers come in and the stock price rises, MM have to buy more and more shares of AMC to control their risk exposure.

On Friday, 5/28, the delta chart above also shows some large negative bars. This implies that traders came in to either sell large call positions, or buy large put positions. This happened when the stock reached its high price for this week of ~$32/share. This negative delta options volume likely meant that MM could sell off large amounts of their long stock hedges, which could have pressured the stock back down to $27/share.

For more information, check out this this video which discusses a few more of the dynamics at play, and what we see happening into next week.

Share This Article

  • Share
  • Twitter
  • LinkedIn
  • Reddit
  • Facebook

Written by developer · Categorized: Market Analysis

Don’t have an account with SpotGamma?

Choose the plan you want today to view unique support and resistance levels, access Founder’s Notes and expert commentary, daily trading ranges, and entrance into our private Discord.


Primary Sidebar

Related Resources

  • Options Exchange Monitor — Week of August 15, 2026 (36 SEC notices, 2 CFTC, 0 EDGAR)

    Options Exchange Monitor — Week of August 15, 2026 (36 SEC notices, 2 CFTC, 0 EDGAR)

    August 17, 2026
  • GEX Levels for SPY, QQQ, ES and NQ: Using Index Gamma in Any Product

    GEX Levels for SPY, QQQ, ES and NQ: Using Index Gamma in Any Product

    August 17, 2026
  • How to Trade GEX Levels: A Practical Guide to Gamma-Based Trading

    How to Trade GEX Levels: A Practical Guide to Gamma-Based Trading

    August 17, 2026
  • Free GEX Levels, Charts, and Data: What’s Available and What It’s Actually Worth

    Free GEX Levels, Charts, and Data: What’s Available and What It’s Actually Worth

    August 17, 2026
  • Covered Calls After Assignment: What to Do When the Stock Drops Below Your Cost Basis

    Covered Calls After Assignment: What to Do When the Stock Drops Below Your Cost Basis

    August 17, 2026
  • youtube
  • x
  • Privacy Policy
  • Disclaimer
  • Terms & Conditions
  • Support Center
  • Media
  • Contact Us

©2026 TenTen Capital LLC DBA SpotGamma

All SpotGamma materials, information, and presentations are for educational purposes only and should not be considered specific investment advice nor recommendations. Futures, foreign currency and options trading contains substantial risk and is not for every investor. An investor could potentially lose all or more than the initial investment. Risk capital is money that can be lost without jeopardizing one's financial security or lifestyle. Only risk capital should be used for trading and only those with sufficient risk capital should consider trading. Past performance is not necessarily indicative of future results. Testimonials appearing on this website may not be representative of other clients or customers and is not a guarantee of future performance or success.

View Full Risk Disclosure