The Dispersion Unwind Arrives
Last week, we noted in our pre-market Founder’s Note that markets were skating on thin ice. In addition to growing macro risks, COR1M had collapsed below 8 signaling extreme dispersion between index and single-stock volatility.
After our Risk Pivot level was breached on Thursday, the growing negative gamma environment amplified the resulting price swings. The Mag 7 basket posted its worst session since the April 2025 tariff-driven selloff, and SPX dropped 1.2% — one of the worst days for the index in weeks.
In short, the dispersion unwind we have been watching for is no longer hypothetical. While earnings from Tesla (-16%) and Google (-7%) dominated last week’s relatively quiet calendar, this next week brings FOMC (July 29) alongside earnings calls from four other Mag7 stocks. This much denser calendar threatens further volatility ahead.
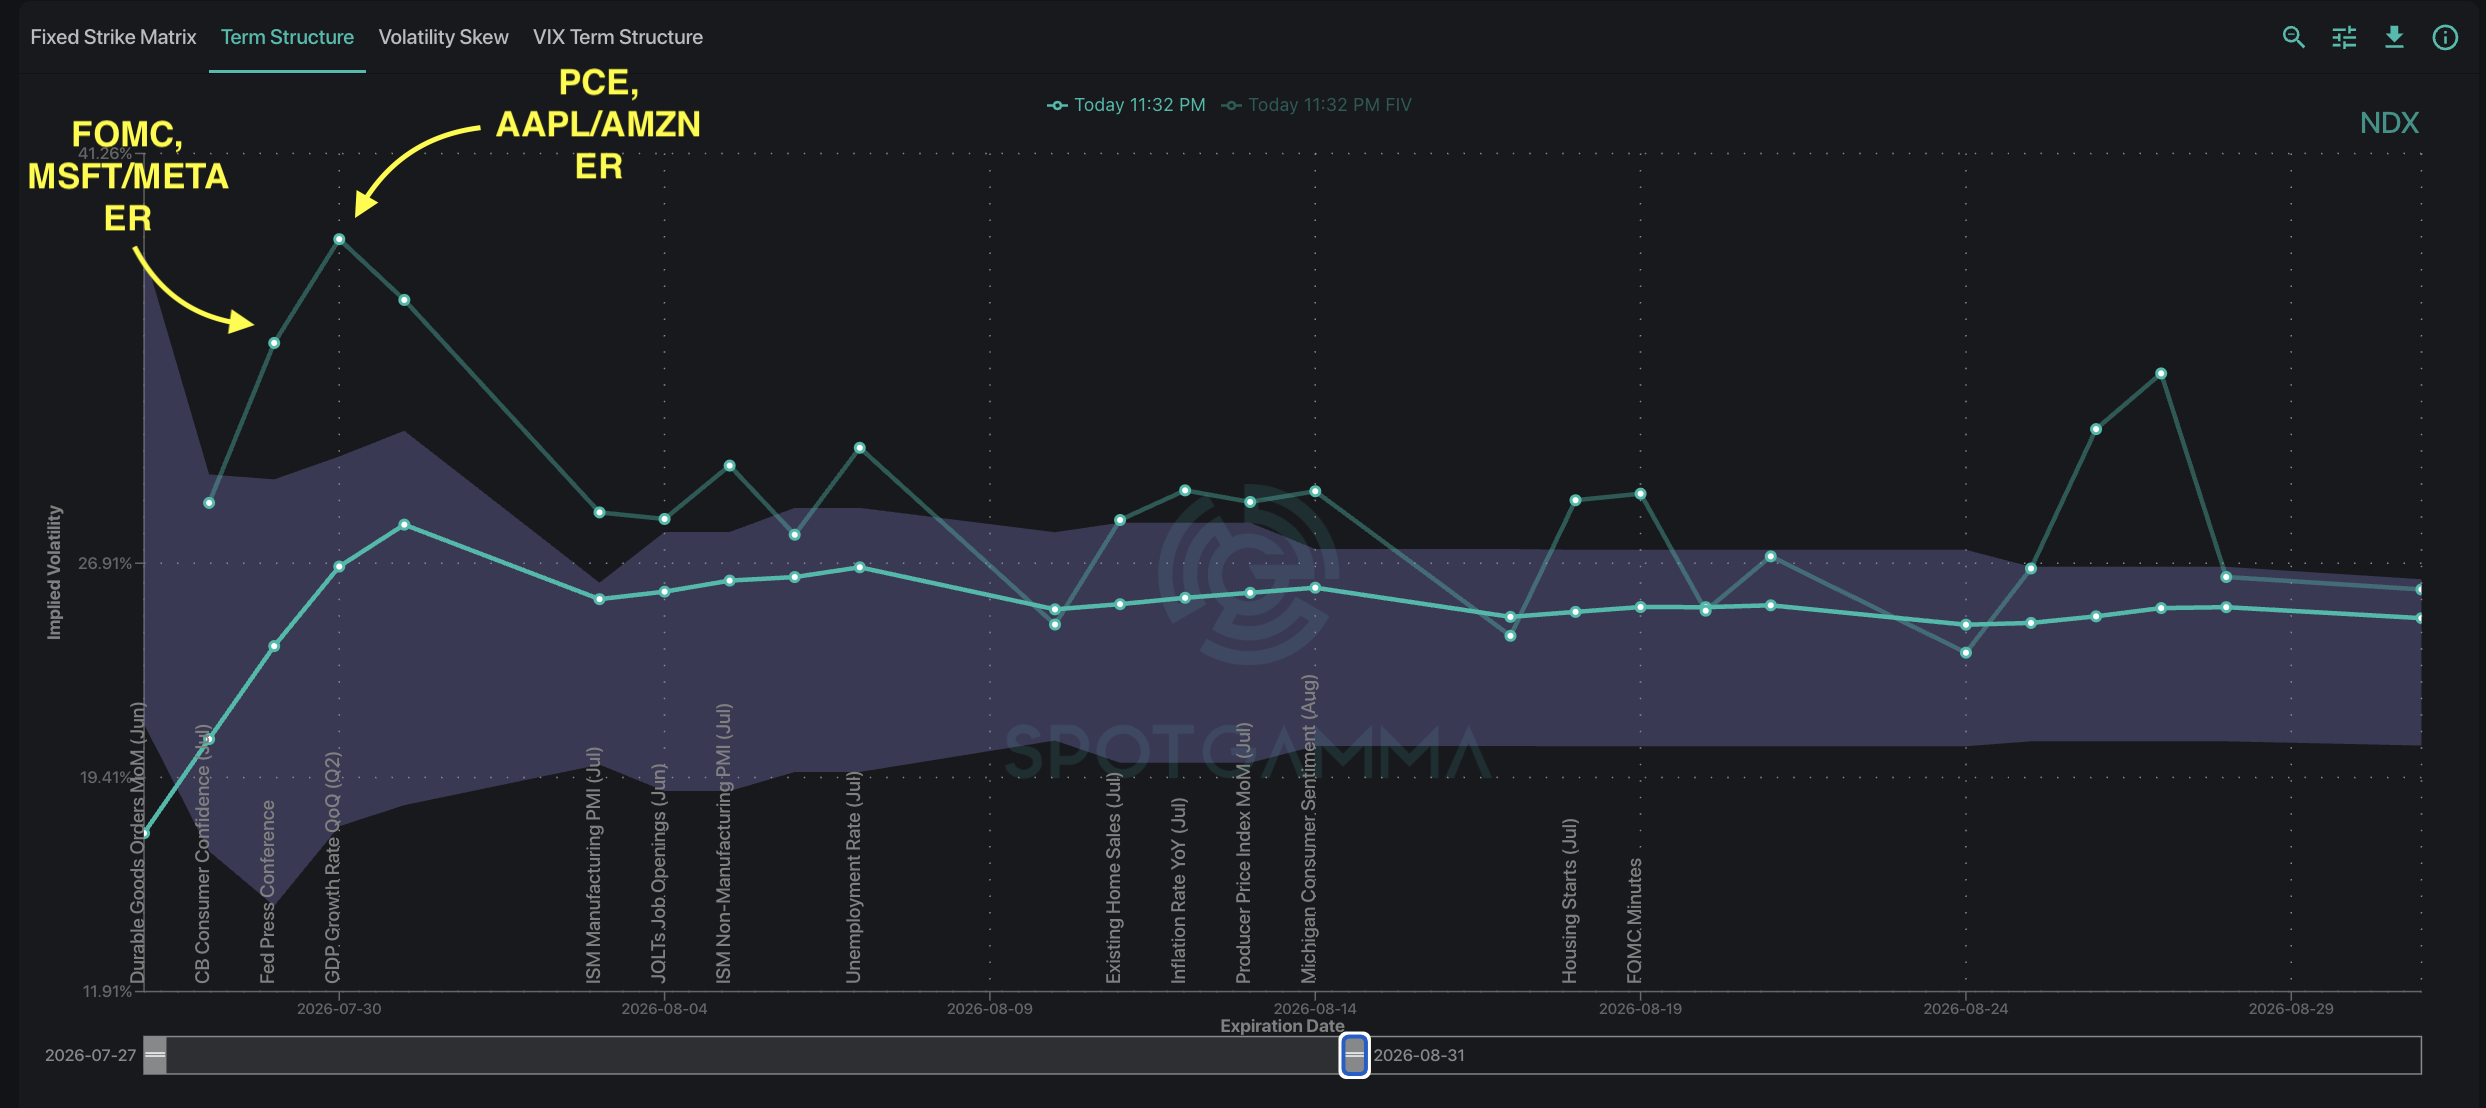
The risk of rising volatility does not appear priced into the SPX Term Structure chart for this next week. At-the-money implied volatility (darker green line) currently trends near the middle of its 90-day range. However, Forward IV (lighter line) is notably higher over the next week, suggesting concentrated event risk ahead.
The heavier event calendar introduces risks to the market — alongside opportunities to capitalize on growing index and single stock volatility. As an example, two single-stock vol trades we discussed on Tastylive performed well over the past week as implied vol jumped.
For earnings trades specifically, analyzing both the volatility conditions and dealer gamma exposure can shed light on specific trade opportunities.
The Event-Heavy Week Ahead
The FOMC policy decision arrives on July 29, followed by PCE inflation data on July 31. With the Fed providing less forward guidance and markets facing greater uncertainty around interest rates, these events each hold the potential to spike volatility.
In addition to macro data prints, this next week also brings earnings reports from four Mag 7 names. Microsoft and Meta report on July 29, followed by Apple and Amazon on July 31. This is a substantial amount of event risk compressed into just two trading sessions.
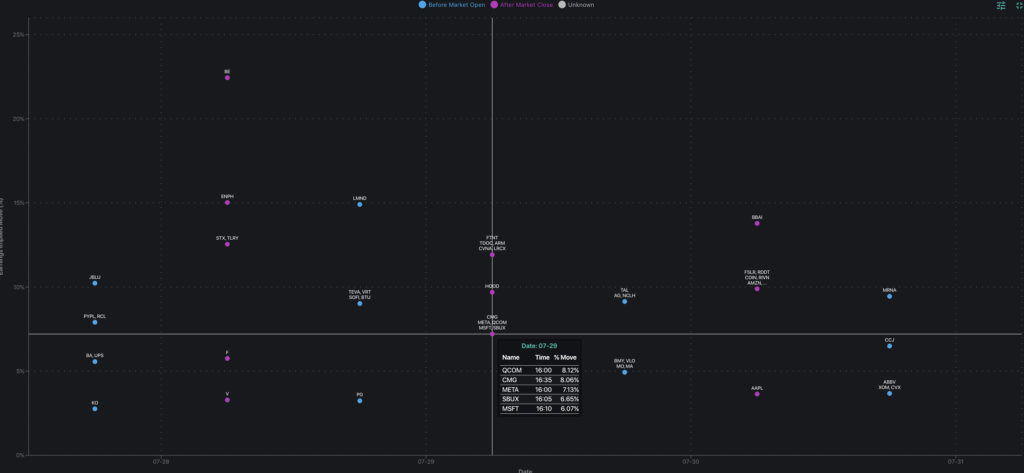
The implied move – the options market’s estimate of the expected post-earnings price swing – sits near 7% for META, while MSFT and AMZN have implied moves closer to 6%. AAPL sits clearly lower near 4%. Given how last week’s earnings played out, the market is clearly not treating these reports as low-risk events.
Trading Earnings: What Does Dealer Gamma Say?
For analyzing individual stocks, dealer gamma positioning provides a roadmap for how these stocks could trade around their earnings releases. MSFT, AMZN, and META all share a similar profile, with supportive positive gamma below the current price and negative gamma above. This gamma profile could help stabilize downside movement while amplifying upside momentum, creating more squeeze-like conditions if earnings surprise to the upside.
Among the four names, Microsoft stands out as having what could be the most compelling gamma profile. Dealers are meaningfully short gamma to the upside, with 390 and 430 as major gamma levels to monitor.
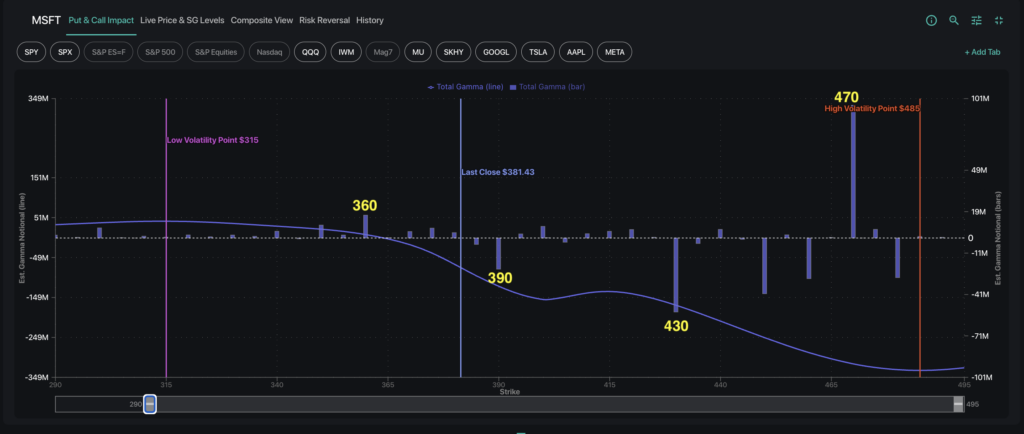
A strong earnings report could trigger a self-reinforcing rally as dealers are forced to buy stock to hedge their negative gamma exposure. On the downside, 360 represents the Gamma Flip level, where positioning transitions from negative to positive gamma. Should price drop below this level, dealer hedging would provide supportive buying pressure.
Notably, MSFT earnings follow the FOMC decision on Wednesday (July 29). After the market witnessed both Google and Tesla move well beyond their implied moves last week, it may be optimal to observe the market’s initial earnings results before structuring trades in the following session.