Update: GME officially announced a 4:1 stock split effective 7/21.
When it comes to meme stocks, AMC and GameStop are at the forefront. On the face of it, they are fairly similar. Both have ardent supporters, similar market caps (~$12bn) and shaky fundamentals. Traders hold roughly 20% of both GME & AMC’s free float short (source, ORTEX). Investors in both companies are counting on some “out of the box” thinking to turn things around – which will hopefully send their stock prices higher.
However, that may be where the comparisons end. While both AMC & GME staged strong rallies into March, which had them outperforming the general market year to date, AMC has now given a lot of that back (now -15% in ’22), while GME remains +10% this year (Ref: 4/1/22).
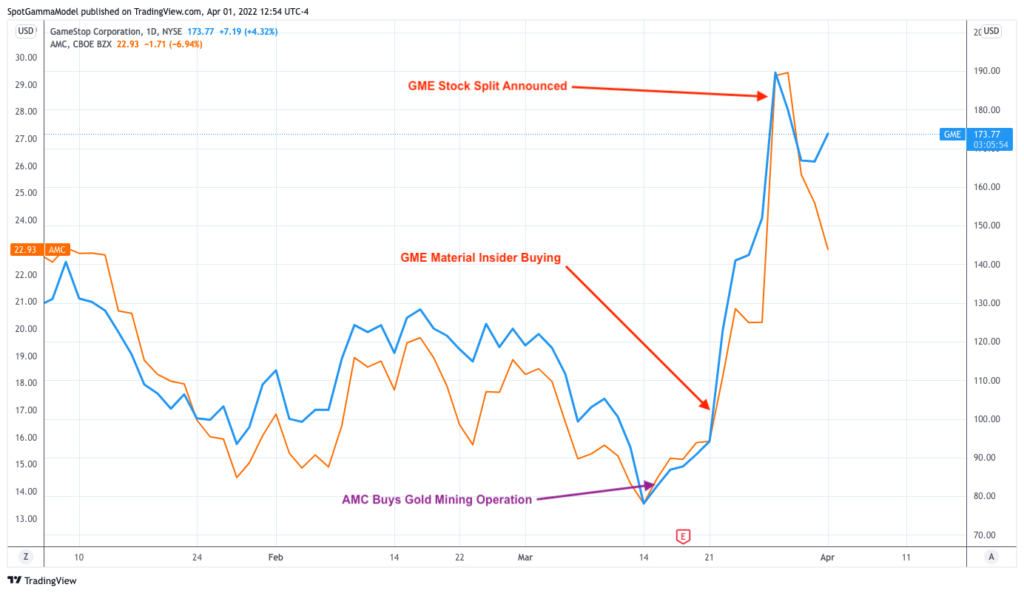
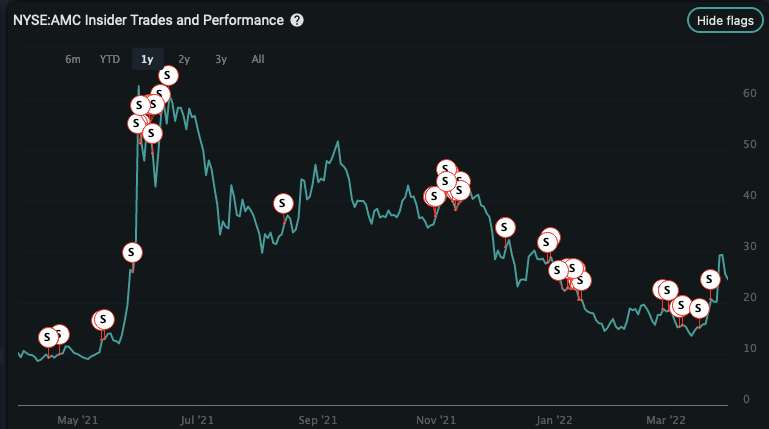
There are differences fundamentally, too. For instance, while GME’s insiders are buying GME shares, AMC’ s insiders are buying….gold miners. Additionally AMC insiders have unloaded >$500mm worth of shares in the last 12 months – with 0 insider buys!
The other major area of divergence is in the options market.
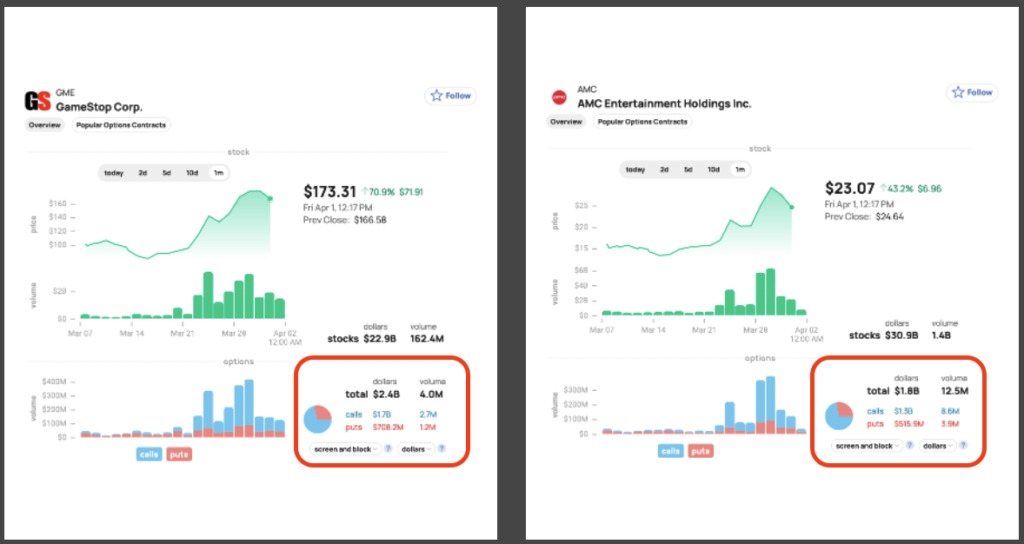
Below is data from our friends at ShiftSearch, wherein we highlight that there was a spike in options activity for both stocks over the past week. For both stocks, this spike in activity was predominately in call options. Along with stronger stock performance, GME(left) did happen to catch more notional call flow than AMC(right) over this past week. However, this options action is atypical.
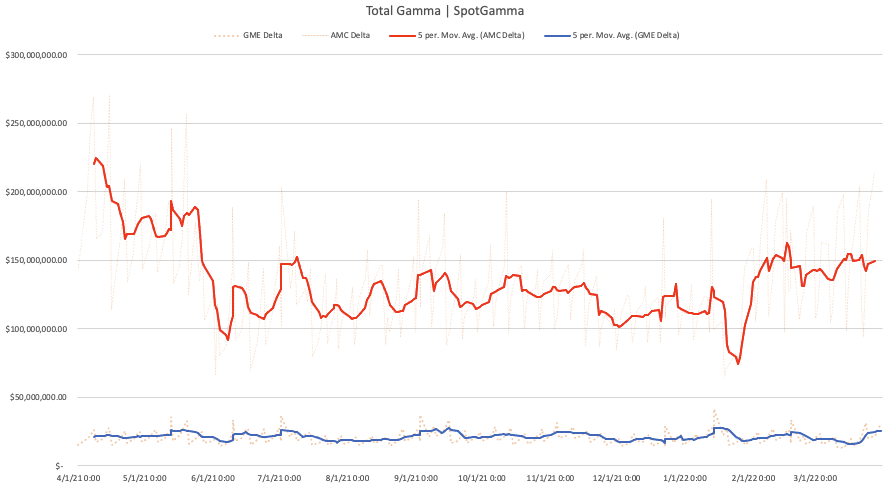
Below we’ve plotted total gamma in both stocks, and you can see the difference is apparent – AMC’s options complex is much larger. Recall that gamma is highest for short term options which are near the prevailing stock price. This gamma differential signals that options might have a larger relative impact on AMC, and this has a few implications.
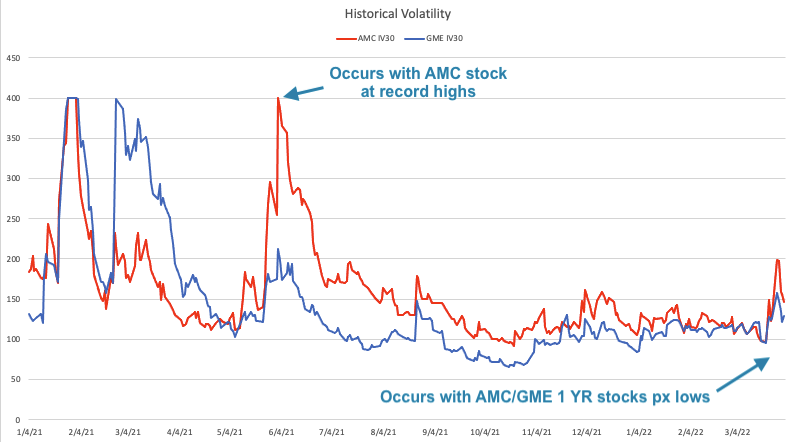
First, it suggests that AMC obviously has a much more options trading, which implies higher volatility for AMC relative to GME. In the chart below you can see this is often the case, save for early 2021. Generally traders link higher volatility with stocks crashing, however in the case of AMC & GME its the opposite. Spikes higher in AMC/GME volatility tend to correlate with moves higher in these stocks price.
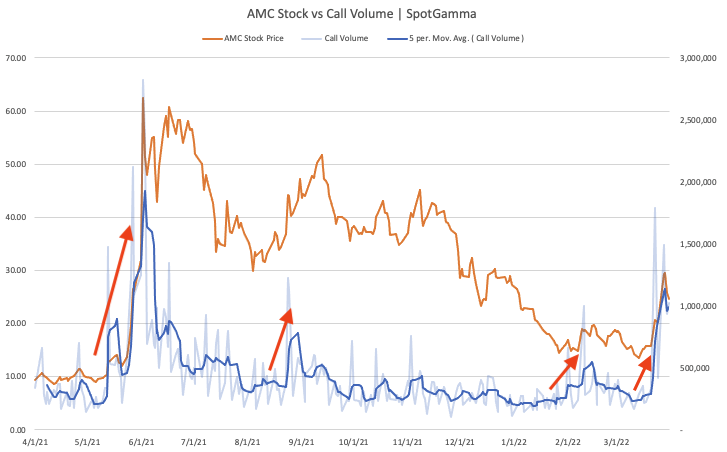
This positive correlation between price and volatility is because of the nature of traders flooding into short term call options (we’ve covered this dynamic extensively, here). As the gamma chart above shows there is more AMC options activity, which can be linked to more volatility. As you can see below the lows in realized volatility for these two names corresponds with 1 year stock price lows. In other words, these stocks tend to “crash up”, and then “recover” when prices decline.
The bulk of both AMC & GME options positions tends to be positioned just 5 days out in time – but with AMC there is just more options positioning. The resulting effect of this elevated options activity in AMC is that in this case it is more destabilizing. Just as a rush of short dated call options can help fuel a rally, their decay and expiration can lead to rapid drawdowns. Further, when the call options activity wanes as it did out of ’21, the stock appears to decline.
We do believe that a big reason for the options traders choosing to trade in AMC vs GME is simply a factor of price. As GME is a $100 stock, its options come at a higher net cost vs AMC. For example the 30 day, at-the-money straddle in AMC is currently trading near $5.5, while in GME it is $33.
Its of note that GME’s is looking to split the shares, which could draw a lot more action into GME’s options market.
These options flows could combine with a management team that is appearing (via share purchases) to stand behind its stock, which one could argue puts a more fundamental bid in place. Further, we believe AMC’s call flow is a consistent catalyst for price ramps. Lower priced GME options could pull flows from AMC, catching its investors with their pants down.
