Last week delivered a string of constructive catalysts that supported the market through Thursday. Inflation ran cooler than expected, bank earnings impressed, retail sales beat, and ASML and TSM offered encouraging commentary towards semiconductor demand. While hostilities with Iran escalated, the market remained quite stable until Friday’s 1% drop following the Kimi-3 announcement.
The stability shown in the S&P 500 throughout this past week — including Friday’s morning reversal — was largely driven by the prevailing positive gamma regime. Positive dealer gamma blanketed the local price range through Friday, leading to mean-reversion as options dealers traded against price action.
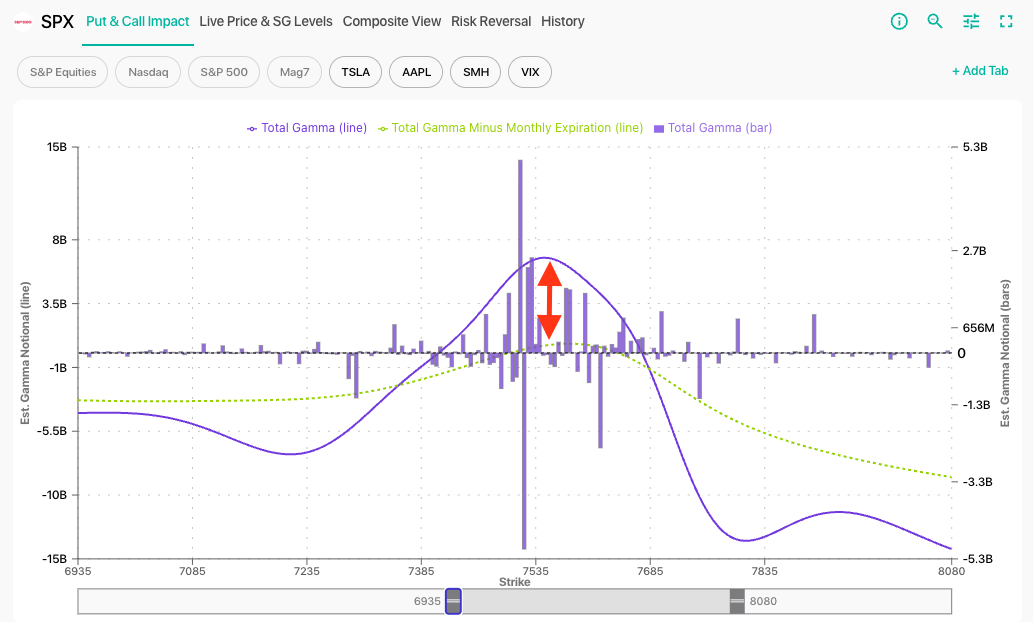
Under our Synthetic OI Model, dealer gamma shifts noticeably lower following July OPEX. The gamma exposure curve above shows this, with the purple line representing total gamma as of Friday, and the yellow line showing gamma after Friday’s expiration. In other words, much of the market’s shock absorber is now removed.
Additionally, the story of capital rotation has been unfolding for the past month. Traders have begun rotating out of the semiconductor complex and into the Mag 7, software, and healthcare. This has dragged SMH to roughly 20% below its all-time high. Yet the uplift in other areas has kept SPX remarkably resilient.
With less positive gamma available to stabilize price movement, positioning can begin to unwind. This allows the market to respond more freely to directional flows. The current post-OPEX setup points to one key question: Will the reduction in positive gamma allow the semiconductor drawdown to finally spill over into the broader market?
We wrote extensively last week about the growing volatility gap between the S&P 500 and Nasdaq. In terms of both realized and implied volatility, SPX appears better suited to absorb dispersion amongst individual components of the index. However, dispersion metrics are also now at extremes — meaning upcoming catalysts have the potential to deliver outsized spikes in volatility.
Earnings Take Over a Quiet Macro Week
The macro calendar becomes relatively light next week, placing the focus squarely on earnings. At SpotGamma, our implied earnings move measures at-the-money straddles for the first expiration date after the earnings announcement. This approximates the expected movement associated with an earnings event.
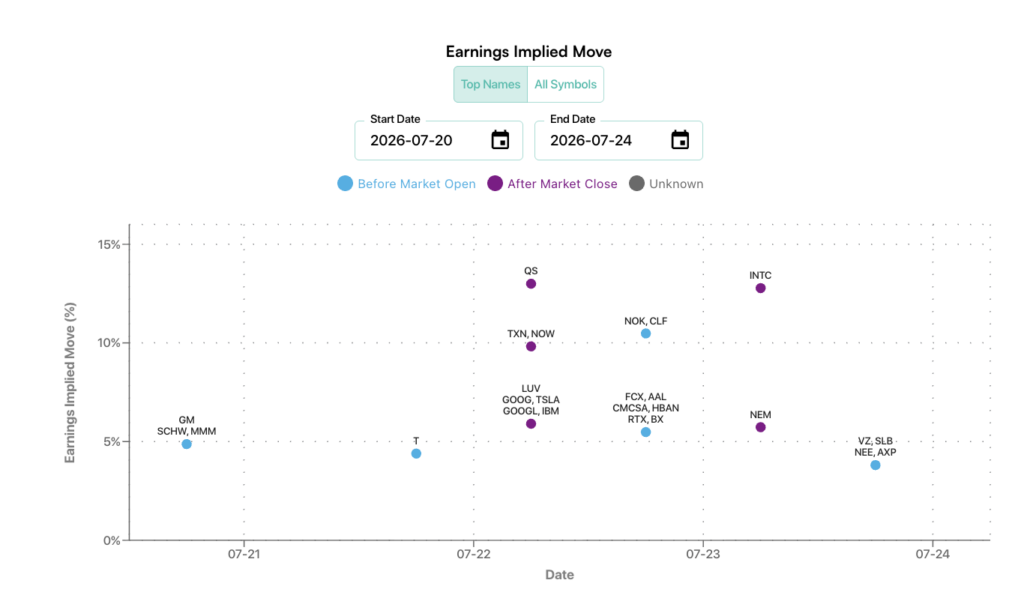
Two members of the Mag 7 – GOOGL and TSLA – report on Wednesday, each with an implied move of ~6%. Several semiconductor and software names also report this next week, including TXN (9%), INTC (13%), and NOW (11%).
Single-stock implied volatility remains elevated for many of the top names across the market. Given that significant positive gamma rolls off for the index following OPEX, earnings reactions hold greater potential to propagate.
Intel Earnings: Unique Setup and Dealer Positioning
Among the upcoming week’s earnings reports, Intel (INTC) stands out for several reasons. INTC carries one of the largest implied moves of all names with earnings next week, and the stock serves as a live test of the AI narrative. Notably, Intel has declined roughly 35% from its recent peak just weeks ago.
Our Synthetic OI Model shows a unique dealer gamma profile for INTC: positive gamma below could limit downside price action, while negative gamma to the upside brings asymmetric upside potential.
INTC closed at 95 on Friday, and our positioning models suggest support may kick in around the 80–90 area, where trader put selling could act as a cushion due to supportive dealer hedging flow. Above Friday’s closing price, negative dealer gamma implies a breakout could accelerate if the stock rallies.
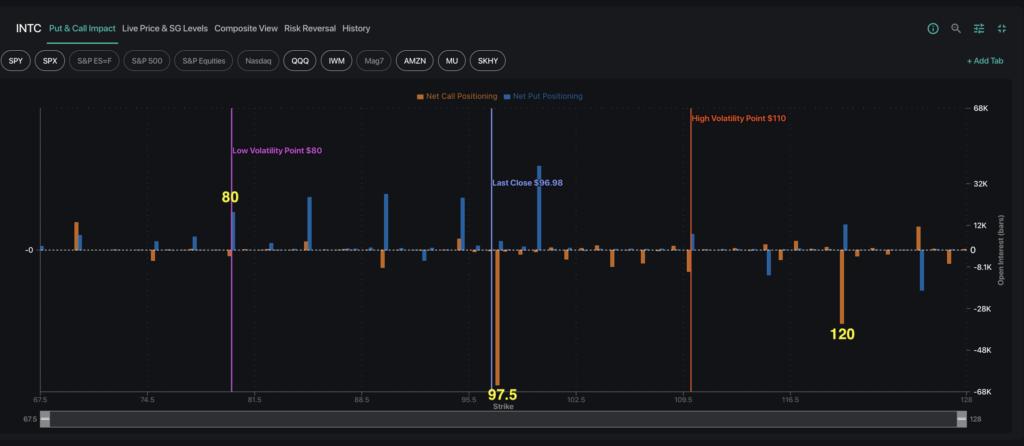
Alongside the options-implied move, the positional analysis shared above helps us understand what post-earnings price action could look like. Earnings are of course a binary event, and options positioning data provides context for either potential paths.
Current positioning leans bullish, suggesting investors are positioned for a favorable earnings outcome. If Intel delivers a positive surprise and the stock rallies, one potential approach would be to consider 25-delta calls following earnings, when implied volatility has reset lower, as a way to participate in trend continuation. Conversely, if earnings disappoint and the stock sells off, traders may watch the 80–90 region for signs of support while monitoring real-time options activity to determine whether it shows evidence of reversing.