Last month, space stocks rocketed their way onto every trader’s radar. SpaceX’s record-breaking June IPO (SPCX) drew a wave of retail and institutional attention to the sector, while a string of NASA announcements made headline news and fueled several meaningful moves.
Overall, the space sector has been defined by a notable downtrend in the past month — despite several noteworthy developments:
- Rocket Lab (RKLB) gained over 25% after announcing a new NASA contract on June 26. However, the rally faded over the following weeks, with RKLB now down 50% from all-time highs achieved in May.
- Intuitive Machines (LUNR) and Firefly Aerospace (FLY) each gained after news broke they would help supply NASA’s next moon mission, yet those gains were erased within a session with both stocks trending down 60% in two months
- SpaceX’s June IPO was expected to be the sector’s liftoff moment, yet instead SPCX has trended downwards since then. SPCX is now trading near 118 on July 22 – roughly 13% below its 135 offering price – weighing down the broader space sector.
After a brief rebound the morning of Tuesday, July 21, traders began to question if the bounce was oversold — and if the sector could take off to new highs.
Using SpotGamma Compass, we screened several space-related stocks—RKLB, LUNR, ASTS, SPCX, FLY, RDW, and PL—plotting each by IV Rank (relative implied volatility) and Risk Reversal Rank (relative call versus put positioning).
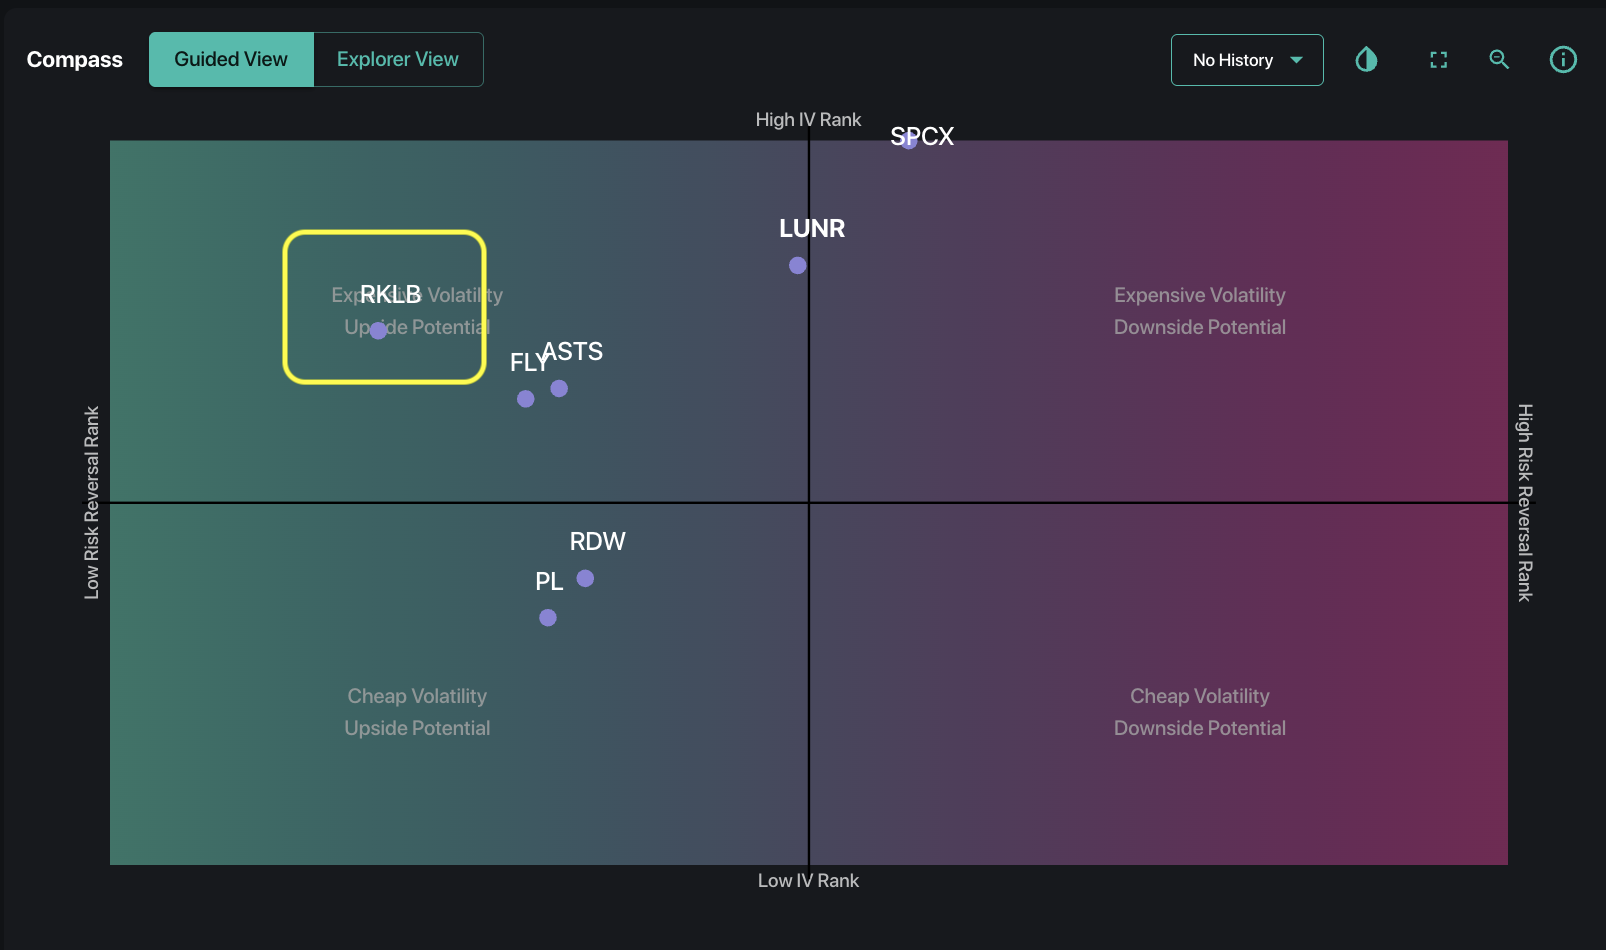
The Compass Guided View uses IV Rank as a measurement of current volatility. IV Rank indicates where current implied volatility sits compared to the prior year’s values — a high IV Rank means volatility is relatively high and options are likely expensive.
Risk Reversal Rank measures the relative pricing of calls versus puts. A lower reading indicates puts are priced richer relative to calls, reflecting more defensive options positioning.
Two observations stand out:
1. Implied volatility is elevated across the group.
The recent selloff has pushed implied volatility higher, with the market pricing continued two-way movement. SPCX carries an IV Rank of 99%, while RKLB sits at 69%.
The practical takeaway is that outright long options may be relatively expensive. Traders looking for bullish exposure may prefer defined-risk spread structures or simply using shares rather than purchasing outright calls.
2. Options positioning remains defensive.
RKLB has the lowest Risk Reversal Rank in the group at 19%, indicating puts remain relatively expensive versus calls.
While the options market is not yet confirming a sustained bullish reversal, elevated put skew can create attractive opportunities for traders looking to express a contrarian bullish view through option structures.
Diving into Rocket Lab specifically, there are several opportunities that we find interesting based on current options positioning.
RKLB — Rocket Lab
Spot: 69 | IV Rank: 69% | Risk Reversal Rank: 19%
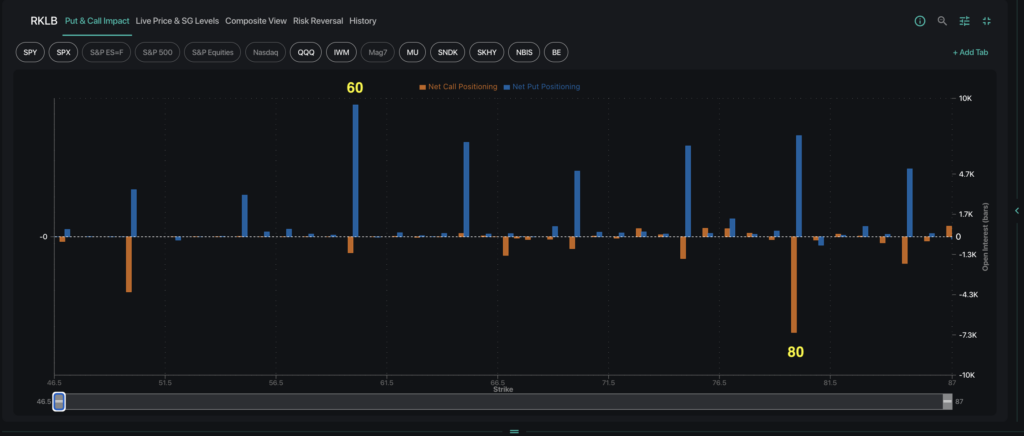
Looking at RKLB in Equity Hub’s Synthetic OI model, the largest concentration of put open interest sits at the 60 strike with roughly 11,000 contracts sold. This may serve as an area where dealer positioning provides potential support. On the upside, the 80 strike contains roughly 8,000 bought call contracts.
How could traders approach a trade here?
The options market is not yet confirming a durable sector reversal. Positioning remains put-skewed, and elevated implied volatility suggests the market continues to price meaningful two-way movement. For now, this appears more consistent with an oversold bounce than a confirmed trend change.
A more constructive outlook would emerge if upside positioning begins to build and dealer positioning shifts toward negative gamma, creating the potential for stronger momentum through dealer hedging flows.
Notably, the upcoming catalysts for this group are both related to SpaceX: SPCX reports earnings on August 4, and the initial stock lockup period expires on August 5. If SpaceX earnings disappoint relative to expectations, or if post-lockup selling creates downward pressure, volatility could increase across the broader space sector.
With many of these companies still in the early stages of commercialization and not yet profitable, this trade thesis is based primarily on options positioning and dealer flow dynamics rather than fundamental valuation.
Note: The below information is for educational purposes only, and does not constitute investment advice.
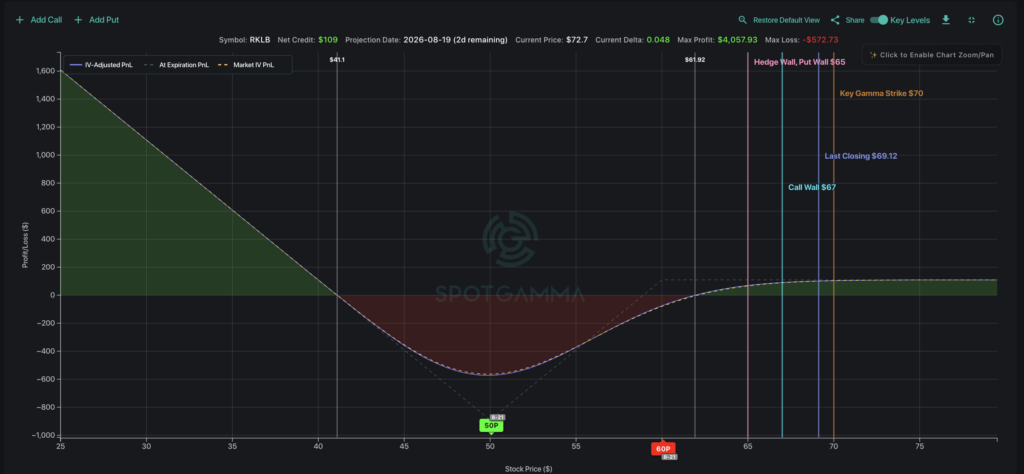
Based on the options positioning discussed above, the above image of our Options Calculator shows an August 1×2 Put Ratio Spread. This trade currently collects approximately $1.20 in premium with the following structure:
- Sell 1 Aug 21 put at the 60 strike (approximately 22 delta)
- Buy 2 Aug 21 puts at the 50 strike (approximately 8 delta)
Selling the 60 put benefits from elevated implied volatility and potential volatility contraction, while the two long 50 puts provide convex downside exposure in the event of a sharp selloff.
Should SpaceX experiences a significant decline around earnings or its lockup expiration, and if that weakness spills over into the broader space sector, the long put component could provide meaningful protection.
Similarly, if RKLB or the broader sector experiences an oversold bounce, this position would benefit from the sold put at 60.
The structure can serve either as a hedge against long equity exposure in space stocks or as a way to express a view that implied volatility will compress while maintaining protection against a tail-risk event.