What a legendary post! Spot on. $SPX 4400 it is! @spotgamma https://t.co/1dbjB9eo8p
— magicavi (@magicavi89) August 25, 2023
The following analysis was revealed in real time both to our SpotGamma members, and posted to our Twitter account, in real time.
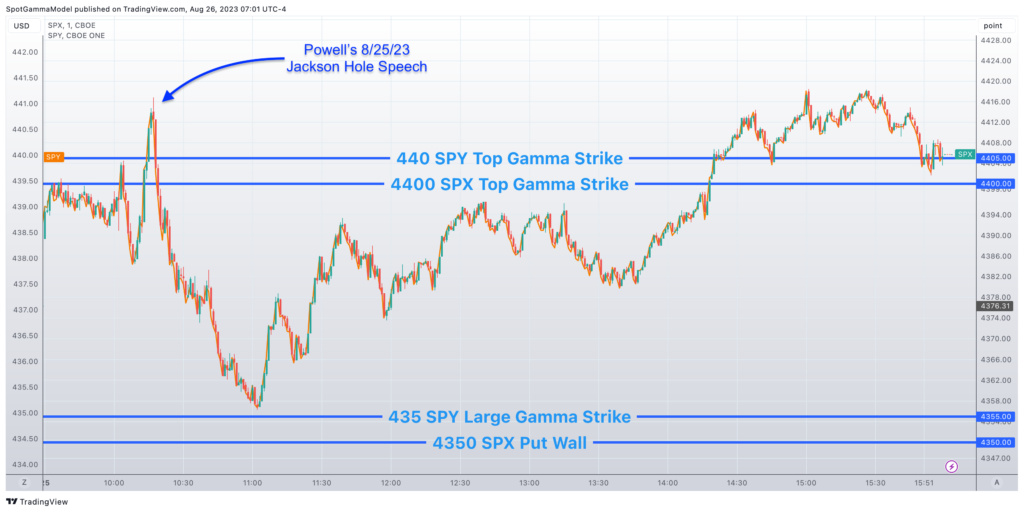
On Friday August 25th Fed Powell gave a speech at the Jackson Hole symposium. This led to a sharp decline in the S&P500, as shown below. This selloff halted just above SpotGamma’s key support level of 435 SPY/4,350 SPX Put Wall.
The market then rallied higher, to close at SpotGamma’s noted resistance of 4,400.
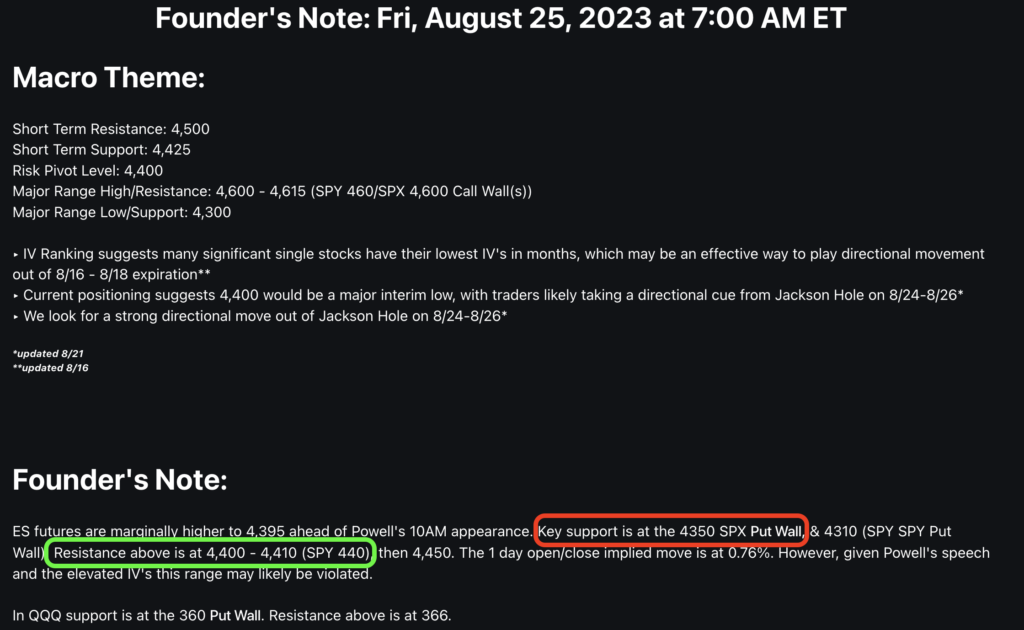
These support and resistance levels were laid out in the SpotGamma premarket Founder’s Note, as shown below:
How 0DTE Options Flows Moved Markets on August 25, 2023
Given the key support and resistance lines outlined above, how were zero DTE options flows involved?
Show below is an 8/25 screenshot from SpotGamma’s HIRO application, which monitors the hedging impact of options flows in real time. While, there are many lines on this chart, each one lays out a critical element to how the S&P500 traded.
In white is S&P500 Index. As you can see by the left axis, the low of the day was just above 4,350 with the market closing at the 4,400 resistance area.
The hedging impact from options from all expiration is orange for calls, and dark blue for puts.
The hedging impact from 0DTE options only is green, and light blue for puts.
If puts are being bought our indicator moves lower as dealers and market makers (options liquidity providers, or “OLP’s”) may need to sell futures to hedge these flows. Conversely if puts are being sold, the indicator will move higher, as OLP’s may need to buy futures back.
It works the opposite way for calls, wherein when calls are being bought our HIRO indicator moves higher as OLP’s may need to buy futures to hedge these flows. Conversely if calls are being sold, the indicator will move lower, and OLP’s may need to sell futures back.
What we see here is that after Powell’s speech, the S&P500 traded nearly 1% lower to 4,355, driven by put buyers from All Expirations (dark blue line). We know these these are put buyers, because our HIRO indicator moves lower. In this case traders likely read Powell’s speech as moderately bearish.
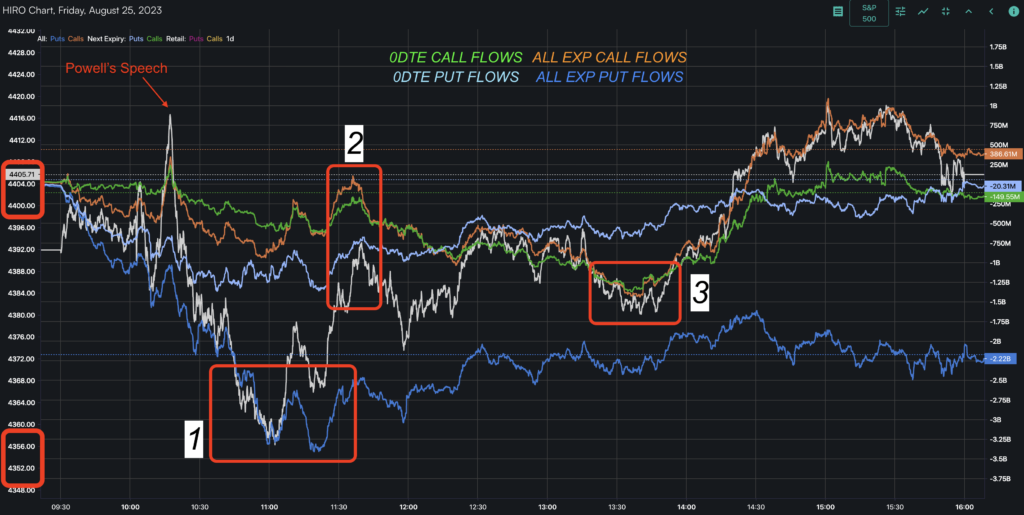
As you can see in the red square “1”, when the market approaches 4,350, the put indicator (dark blue) stops moving lower around 11 AM ET, and begins to turns higher. This tells us that at this level traders stopped buying puts, and as the downward market momentum stopped, traders turned to selling puts.
The light blue 0DTE put line shows only the hedging impact from 0DTE puts moves higher in tandem with the dark blue All Expiration put line.
This informs us that the bulk of put trading at this time was 0DTE put selling options flow. In other words – 0DTE put sellers came in at the market lows, creating hedging flows that likely pushed the market higher.
As you can see out of the red square “1”, the market rallied sharply to 4,390, as highlighted in red box “2”. What happens then, is our call flow lines (0DTE green, All Exp orange) begin to move lower. At this point the 0DTE call indicator (green) and All Expiration call indicator (orange) begin to move lower, in coordination.
What this is telling us is that nearly all of the call options flow in this timeframe of 11:30AM ET (red box 2) to 1:30PM ET (red box 3) is 0DTE call selling. This occurs into our noted resistance of 4,400.
Its at 1:30 ET that the 0DTE call selling stops, and starts to turn into 0DTE call buying. Why? We believe this is for two reasons:
- Put selling persisted throughout the day, putting upward pressure on the market
- 0DTE calls have a high rate of decay. This likely means that traders are short “cheap” calls, that expose them to a lot of risk into the end of the day.
If you sold a call option at the 11:30AM highs, it decayed until 1:30PM and probably had little to no value. Further, once the market starts to exhibit a bit of upside resiliency, you’re more incentivized to close your 0DTE short call position.
What results from this, in red box “3”, is a very strong 0DTE call buying (short call cover) trade. Once again we see that the 0DTE call flows (green) are perfectly overlaid with the All Exp call flows (orange), which informs us that the call buying flow, and correlated move higher in stocks, is purely driven by 0DTE.
This correlation breaks around 2:30 PM, just as the S&P revisits major resistance of 4,400. Its at this point wherein the orange line extends over that of the green 0DTE. This implies some traders started to buy longer dated calls into 3:30PM.
We also see all of the put flows “turn off” near 2:30PM as indicated by the fact that the blue lines remain horizontal for the remainder of the trading session.
How Can You Monitor 0DTE Options Flows?
We hope that this study into how 0DTE options flows impact markets was insightful. If you want to try out our HIRO indicator, simply sign up for a free 7 day trial, here.