No, I’m sure they arent. But there are a lot of overlap. From our recent subscriber notes:
2950 should now set up as the High Gamma strike resistance with 2900 the first line of support. As we are in positive gamma territory we see decreased risk of a sharp sustained drop from this level – meaning the expected one day forward return for the SPX shifts towards ±1%. For bulls we want to see increased open interest build here, especially in call options. There remains decent call interest at the 3000 level which is now within striking distance. Should we move toward that level positive gamma should build, which increases market support and drives VIX/implied vol lower. This would usher in a self reinforcing cycle of positive gamma which is similar to the markets at the start of the year, and quite a contrast from the negative gamma cycle of March/early April.
Thursday 4/29/30 PM NOTE
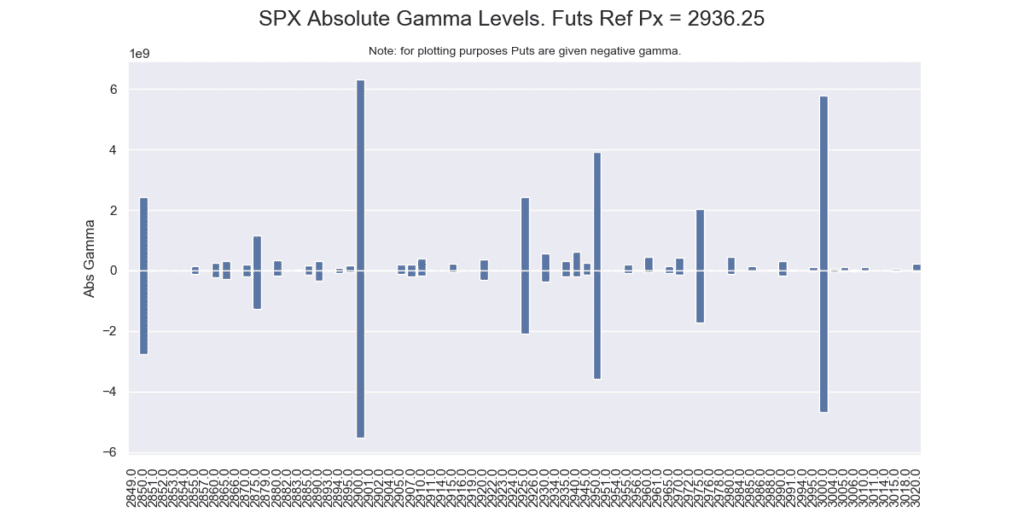
Futures tested 2970 overnight before reverting towards yesterdays cash close level. We saw a bunch of interesting shifts in levels overnight. First, it appears that there was a reduction in calls at both the 2900 and 3000 strike. There was also a lot of put activity at 2900. Net this leaves 3000 reading as our “top absolute gamma” strike, but just barely larger than 2900. This means we have two large gamma zones: 2900 and 3000 (see top chart here). The question outstanding is which zone has the most pull? The 2900/3000 range could be an area that takes some time to resolve (aka consolidation) if equity/futures volumes remain low. This would elevate the impact of dealer gamma and hedging, which is tied to these zones and make help the range hold.
Friday 4/30/30 AM NOTE
As per Nomura, h/t ZH:
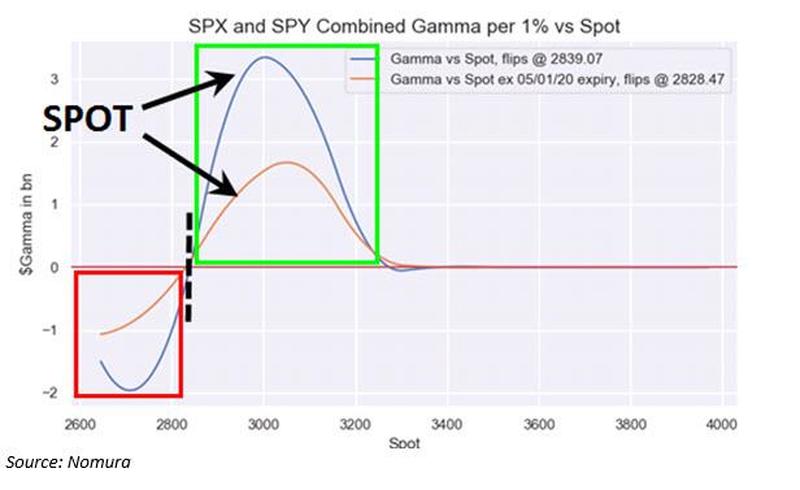
Meanwhile, as pointed out previously, the higher the market rose – start of the recession notwithstanding – the greater the gamma push, and as we have recently seen the aggregate SPX/SPY dealer positioning flip from what had been “short gamma” to then a “neutral gamma” one and now increasingly outright “long gamma” (approaching overwriter strikes), Nomura “sees the benefits of “vol suppressing” dealer hedging behavior with these grinding, less spastic market moves, while the largest Gamma strikes shift higher on the move, with the biggest gamma strike now at the nice, round 3,000.
US Equities continue to sit near 2 month highs, to the shock of many who “fundamentally” remain focused on the obviously horrific economic ramifications of the COVID19 shutdown…but without an appreciation of the ability within the Equities market to “pull forward” future inflections, on top of client positioning dynamics, vol dealer positioning / hedging realities and the “sling-shot” that is a market structure built-upon “negative gamma” which creates this seemingly rolling “Crash DOWN, then Crash UP” cycle.
Effectively, in a “VaR” risk management world where volatility is the exposure toggle—the implications of vol resetting LOWER (following a “macro shock” spike) then has a tendency to contribute to sling-shot HIGHER in spot Equities, as vol control & target volatility strategies mechanically need to re-leverage risk exposures, while “expensive vol” / inverted VIX term-structure, per the back-testing model-driven systematic community, signals an “all-clear” to load back into “short vol” behavior…all of which feeds into the risk virtuous cycle
“Peak pessimism” in late March (selling into cash, slashing net length exposure, grossing-up of shorts, dynamic hedging in futs / downside in index and ETF options/ upside in VIX futs), historic “Momentum Unwind” seasonality in April, unprecedented CB asset purchases & liquidity on top of government fiscal stimulus, and the tendency for “reflation” sensitives to outperform “as the recession hits” have all created a brutal backdrop for said “shorts” to explode to the upside—all despite being economically sensitive plays into a crashing economy
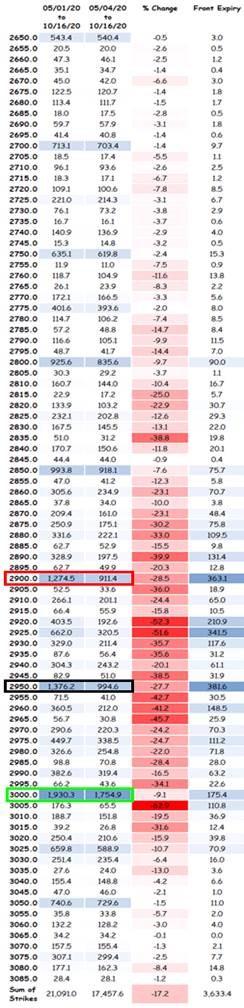
Note below Nomura lays out each strike, highlighting the key areas where all of the open interest sits. We produce similar data but in a way thats easier to visualize (for subscribers). You can see the size at 2900 & 3000, as “boxed” by the Nomura chart (below ours)