
• Skip to main content
  • Skip to primary sidebar

SpotGamma™

S&P 500 Stock Market Gamma Trading Levels Based on Options Open Interest

  • About
  • Pricing
  • Academy
    • FREE TRADE PLANNING WEBINAR
  • Resources
    • Tool Demos
    • Case Studies
    • Blog
    • Support Center
    • Daily Report
    • Free Trading Tools
      • Opening Setup Free Report
      • Options Profit Calculator
      • SPX Gamma Exposure
      • Implied Earnings Moves
    • Report Card
  • Login

put skew

Oct 23 2026

Rising Correlation Is Thinning Out The Rotation Trade

Rising Correlation Is Thinning Out The Rotation Trade

Rising correlation, firmer fixed-strike vol and steeper 3-month put skew suggest the rotation trade is weakening. See where hedges still look cheap.

Written by SpotGamma · Categorized: Market Analysis · Tagged: Brent Kochuba, correlation, hedging, implied volatility, IWM, put skew, SMH, SPY, tastylive

Oct 22 2026

Tech Selloff Looks Like Rotation: Brent Kochuba on Schwab Network
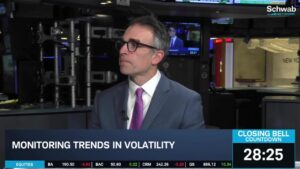
Tech Selloff Looks Like Rotation: Brent Kochuba on Schwab Network

Tech options positioning shows light put demand and short-vol bets into Meta and SPCX earnings, a mix that reads as rotation rather than de-risking.

Written by SpotGamma · Categorized: Market Analysis · Tagged: earnings, implied volatility, Leveraged ETFs, META, ORCL, put skew, Schwab Network, SPCX, TSLA

Oct 21 2026

META Earnings Preview: Will Volatility Outrun the Options Market?
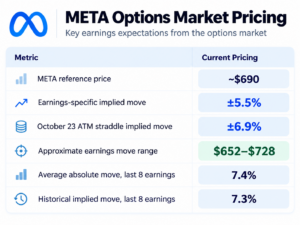
META Earnings Preview: Will Volatility Outrun the Options Market?

Meta Platforms (META) reports Wednesday with investors weighing AI monetization against an increasingly expensive infrastructure buildout. For options traders, the question is different: Is the market charging enough premium for another outsized earnings gap?

Written by SpotGamma · Categorized: Market Analysis · Tagged: broken wing butterfly, butterfly, earnings, gamma, implied volatility, META, negative gamma, put skew

Oct 01 2026

Index Put Protection Is Cheap With 10-Year Treasury Bonds at 5.3%

Index Put Protection Is Cheap With the 10-Year at 5.3%

SpotGamma founder Brent Kochuba joined tastylive to explain why index put protection stays cheap with the 10-year at 5.3% and bond volatility climbing.

Written by SpotGamma · Categorized: Market Analysis · Tagged: bond yields, hedging, implied volatility, negative gamma, put skew, tastylive, TLT, VIX, volatility risk premium

Sep 29 2026

Index Put Demand Returns Ahead of Friday’s Jobs Report

Index Put Demand Returns as the VIX Prices 1% Days

Brent Kochuba, founder of SpotGamma, on tastylive: index put demand, same-day options flow, and why weekly vol prices almost no risk premium.

Written by SpotGamma · Categorized: Market Analysis · Tagged: 0DTE, dealer hedging, IWM, Micron earnings, put skew, QQQ, realized volatility, tastylive

Sep 16 2026

AI Stocks Options Positioning: Call Selling, Not Put Buying
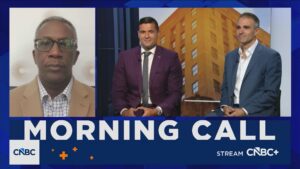
AI Stocks Options Positioning: Call Selling, Not Put Buying

Brent Kochuba of SpotGamma joined CNBC on September 16 to read AI stocks options positioning, bond ETF put skew and rising correlation.

Written by SpotGamma · Categorized: Market Analysis · Tagged: AI stocks, bond ETFs, call selling, CNBC, correlation, interest rates, options positioning, put skew

Jul 22 2026

Space Stocks: Oversold Bounce or Ready for Liftoff?
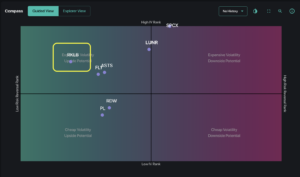
Compass chart showing space stock tickers positioned by IV rank and risk reversal, with RKLB highlighted in yellow box.

Last month, space stocks rocketed their way onto every trader’s radar. SpaceX’s record-breaking June IPO (SPCX) drew a wave of retail and institutional attention to the sector, while a string of NASA announcements made headline news and fueled several meaningful moves. Overall, the space sector has been defined by a notable downtrend in the past […]

Written by Sherry An · Categorized: Market Analysis, Stock · Tagged: dealer gamma, implied volatility, options market analysis, options positioning, put ratio spread, put skew, RKLB, Rocket Lab options, space stocks, SpaceX earnings, SpaceX IPO, SPCX

Apr 05 2026

How One Key Level Drove Last Week’s Rally
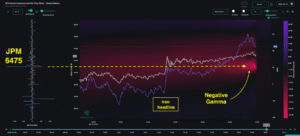
SPX gamma exposure and net OI chart showing price movement with negative gamma spike and Iran headline event on Mar 31, 2026.

The S&P 500 bounced back 2% last week after scraping against 6-month lows. Mixed headlines on the Iran conflict explained much of this tug-of-war, yet markets are still holding their breath. For many traders, the rally felt counterintuitive: How can equities rally so furiously if geopolitical uncertainties remain unresolved? When looking at Tuesday’s major bounce in […]

Written by Simon Scholten · Categorized: Market Analysis, SpotGamma Weekly · Tagged: dealer gamma, dealer positioning, FOMC, geopolitical risk, implied vol, iv, JPM Collar, negative gamma, OPEX, put skew, realized vol, spotgamma weekly, SPX, trace, volatility

Mar 22 2026

After OPEX: Market Loses Its Shock Absorber
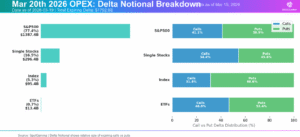
Stacked bar charts showing March 20, 2026 OPEX delta notional breakdown by asset class, with calls vs puts distribution percentages.

The options market has just cleared one of the largest structural events of the quarter, as Friday’s OPEX saw nearly $1.4 trillion in delta notional expire for the S&P 500. Because significant positions have now rolled off from the March expiration, the market has lost an important stabilizing force just as macro pressures begin to build. […]

Written by Simon Scholten · Categorized: Market Analysis, SpotGamma Weekly · Tagged: dealer gamma, dealer positioning, FOMC, geopolitical risk, implied vol, iv, negative gamma, OPEX, put skew, realized vol, spotgamma weekly, SPX, trace, VIX, volatility, Volatility Skew

Mar 15 2026

March OPEX: Tipping Point or Turning Point?
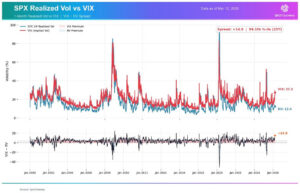
Two charts comparing SPX 1-month realized volatility against VIX implied volatility from 2000-2026, with their spread displayed below.

Fragility, Risk, and Potential Vol Reset As the S&P 500 enters OPEX week, we echo the same theme of the past few weeks: this market remains fragile. Last week’s selloff pushed the index below the three-month trading range of SPX 6,800-7,000 that had held since late 2025, subsequently closing down 5% since mid-January. The conflict with Iran continues […]

Written by Simon Scholten · Categorized: Market Analysis, SpotGamma Weekly · Tagged: dealer gamma, dealer positioning, FOMC, geopolitical risk, implied vol, iv, negative gamma, put skew, realized vol, spotgamma weekly, SPX, trace, VIX, volatility, Volatility Skew

  • Go to page 1
  • Go to page 2
  • Go to Next Page »

Primary Sidebar

SpotGamma-Subscriber-Signup-Banner

  • CoreWeave Earnings Preview: Can AI Demand Outrun the Cost of Growth?
  • CPI Preview: Can Cooling Inflation Stabilize Stocks—or Trigger Another Volatility Shock?
  • The Mechanics Behind Thursday’s Selloff
  • Hedges Rolled Down, Not Off: Brent Kochuba on Excess Returns
  • The Volatility Trap: What Options Markets Reveal About the Next Two Weeks
  • youtube
  • x
  • Privacy Policy
  • Disclaimer
  • Terms & Conditions
  • Support Center
  • Media
  • Contact Us

©2026 TenTen Capital LLC DBA SpotGamma

All SpotGamma materials, information, and presentations are for educational purposes only and should not be considered specific investment advice nor recommendations. Futures, foreign currency and options trading contains substantial risk and is not for every investor. An investor could potentially lose all or more than the initial investment. Risk capital is money that can be lost without jeopardizing one's financial security or lifestyle. Only risk capital should be used for trading and only those with sufficient risk capital should consider trading. Past performance is not necessarily indicative of future results. Testimonials appearing on this website may not be representative of other clients or customers and is not a guarantee of future performance or success.

View Full Risk Disclosure