• Skip to main content
  • Skip to primary sidebar

SpotGamma™

S&P 500 Stock Market Gamma Trading Levels Based on Options Open Interest

  • About
  • Pricing
  • Academy
  • Resources
    • Tool Demos
    • Case Studies
    • Blog
    • Support Center
    • Free Daily Report
    • Free Trading Tools
      • Options Profit Calculator
      • SPX Gamma Exposure
      • Implied Earnings Moves
      • Volatility Ranking
    • Free Training
    • Report Card
  • Login

options market analysis

Jul 22 2026

Space Stocks: Oversold Bounce or Ready for Liftoff?

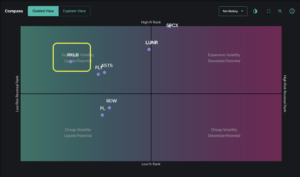
Compass chart showing space stock tickers positioned by IV rank and risk reversal, with RKLB highlighted in yellow box.

Last month, space stocks rocketed their way onto every trader’s radar. SpaceX’s record-breaking June IPO (SPCX) drew a wave of retail and institutional attention to the sector, while a string of NASA announcements made headline news and fueled several meaningful moves. Overall, the space sector has been defined by a notable downtrend in the past […]

Written by Sherry An · Categorized: Market Analysis, Stock · Tagged: dealer gamma, implied volatility, options market analysis, options positioning, put ratio spread, put skew, RKLB, Rocket Lab options, space stocks, SpaceX earnings, SpaceX IPO, SPCX

May 17 2026

NVDA earnings vs. a stretched S&P 500

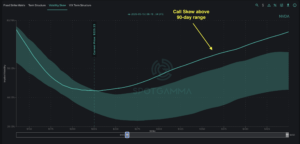
Volatility skew chart for NVDA showing call skew above the 90-day range with implied volatility on the y-axis and strike price on the x-axis.

For the fourth consecutive week, the S&P 500 has struck records highs. This week’s breach of SPX 7,500 even arrived in the face of hotter-than-expected CPI and PPI prints — data that historically would have triggered a meaningful selloff. The tone shifted somewhat on Friday, as the rally lost steam into monthly OPEX. The week […]

Written by Sherry An · Categorized: Market Analysis, SpotGamma Weekly · Tagged: call options, dealer gamma, dealer hedging, Gamma Exposure, implied vol, market makers, May OPEX 2026, NVDA earnings, NVDA implied move, options market analysis, options volatility skew, semiconductor stocks, spotgamma weekly, SPY put butterfly, tail hedge options

May 10 2026

The AI Trade Roars — But for How Long?
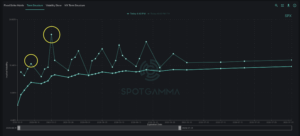
SPX term structure chart showing implied volatility curves from May to July 2026 with two circled peaks.

Last week, strong earnings pushed both the S&P 500 and Nasdaq to — once again — achieve all-time highs. Through the fast and furious AI-driven rally of the past 6 weeks, SPX has climbed 15% while NDX has surged 28%. The market’s pace of advance is well beyond historical norms, reflecting an exceptionally aggressive repositioning […]

Written by Sherry An · Categorized: Market Analysis, SpotGamma Weekly · Tagged: 0DTE options, call options, dealer gamma, dealer hedging, earnings, Gamma Exposure, implied vol, market makers, May OPEX 2026, options market analysis, semiconductor stocks, spotgamma weekly, SPX options, VIX expiration, volatility

Primary Sidebar

SpotGamma-Subscriber-Signup-Banner

  • Hedging Against a Volatility Spike: VIX Calls vs. SPX Puts
  • September OPEX Options Positioning: Why 7,600 Is the Line | The OPEX Effect
  • S&P 500 Negative Gamma Below 7,600 — Brent Kochuba on tastylive
  • CPI Is the Catalyst. 7600 Is the Trade.
  • Trade Idea Generation Using Opening Setup
  • youtube
  • x
  • Privacy Policy
  • Disclaimer
  • Terms & Conditions
  • Support Center
  • Media
  • Contact Us

©2026 TenTen Capital LLC DBA SpotGamma

All SpotGamma materials, information, and presentations are for educational purposes only and should not be considered specific investment advice nor recommendations. Futures, foreign currency and options trading contains substantial risk and is not for every investor. An investor could potentially lose all or more than the initial investment. Risk capital is money that can be lost without jeopardizing one's financial security or lifestyle. Only risk capital should be used for trading and only those with sufficient risk capital should consider trading. Past performance is not necessarily indicative of future results. Testimonials appearing on this website may not be representative of other clients or customers and is not a guarantee of future performance or success.

View Full Risk Disclosure