The S&P 500 has spent much of the summer grinding steadily higher to achieve record highs. Meanwhile, implied volatility has reset toward yearly lows for both major indices and many single stocks. When options become this cheap, the price of volatility itself can open new trading opportunities.
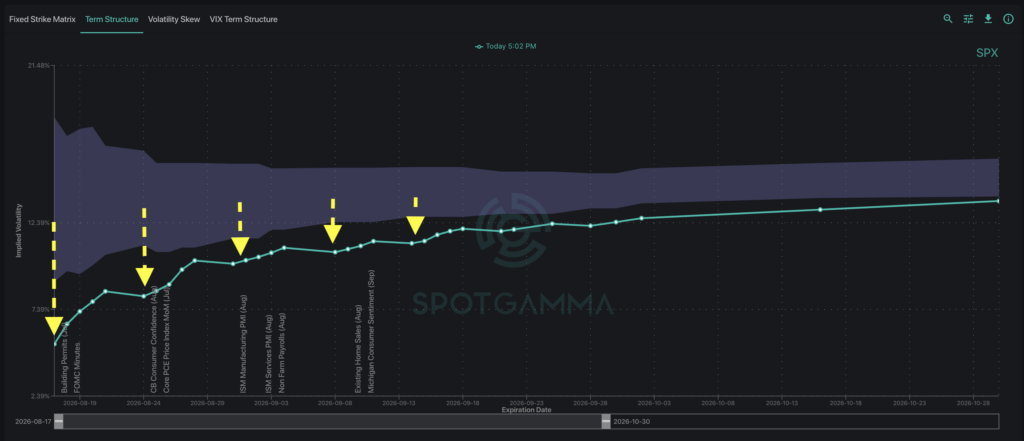
The Term Structure chart reveals current SPX at-the-money IV (teal line) rests well below the 90-day range (shaded area). Interestingly, shorter-dated IVs have been crushed the most, while longer-dated IVs have declined relatively less. That pattern creates a contango structure, where IVs gradually rise further out in time.
Implied volatility measures annualized expectations of price movement for a given asset, derived from the options market. Consequently, comparing IVs of equivalent options contracts can be used to measure the relative value of options prices.
The current contango structure implies that the market places an increasing premium on the uncertainty surrounding longer-dated contracts. For options traders specifically, opportunity often exists to capitalize on this uncertainty-based volatility premium.
For pure volatility plays, structures such as long straddles capture volatility mispricings regardless of direction. For more directional traders, long spreads and similar unilateral positions capitalize on both magnitude and movement in a specific direction — and benefit from a closer look at positioning mechanics.
Straddles: Capturing Volatility, Regardless of Direction
For traders who want volatility exposure without a directional view, one of the most basic strategies remains the long straddle. A long straddle means buying a call and a put at the same strike and expiration. The position can benefit if the market moves far enough in either direction before expiration.
As a long-options strategy, straddles benefit from convexity: the ability to pay an upfront premium for potentially outsized returns. Using SpotGamma’s Options Calculator below, we can view a long SPX straddle expiring August 28. The yellow dotted arrows show how the straddle’s value shifts as time passes.
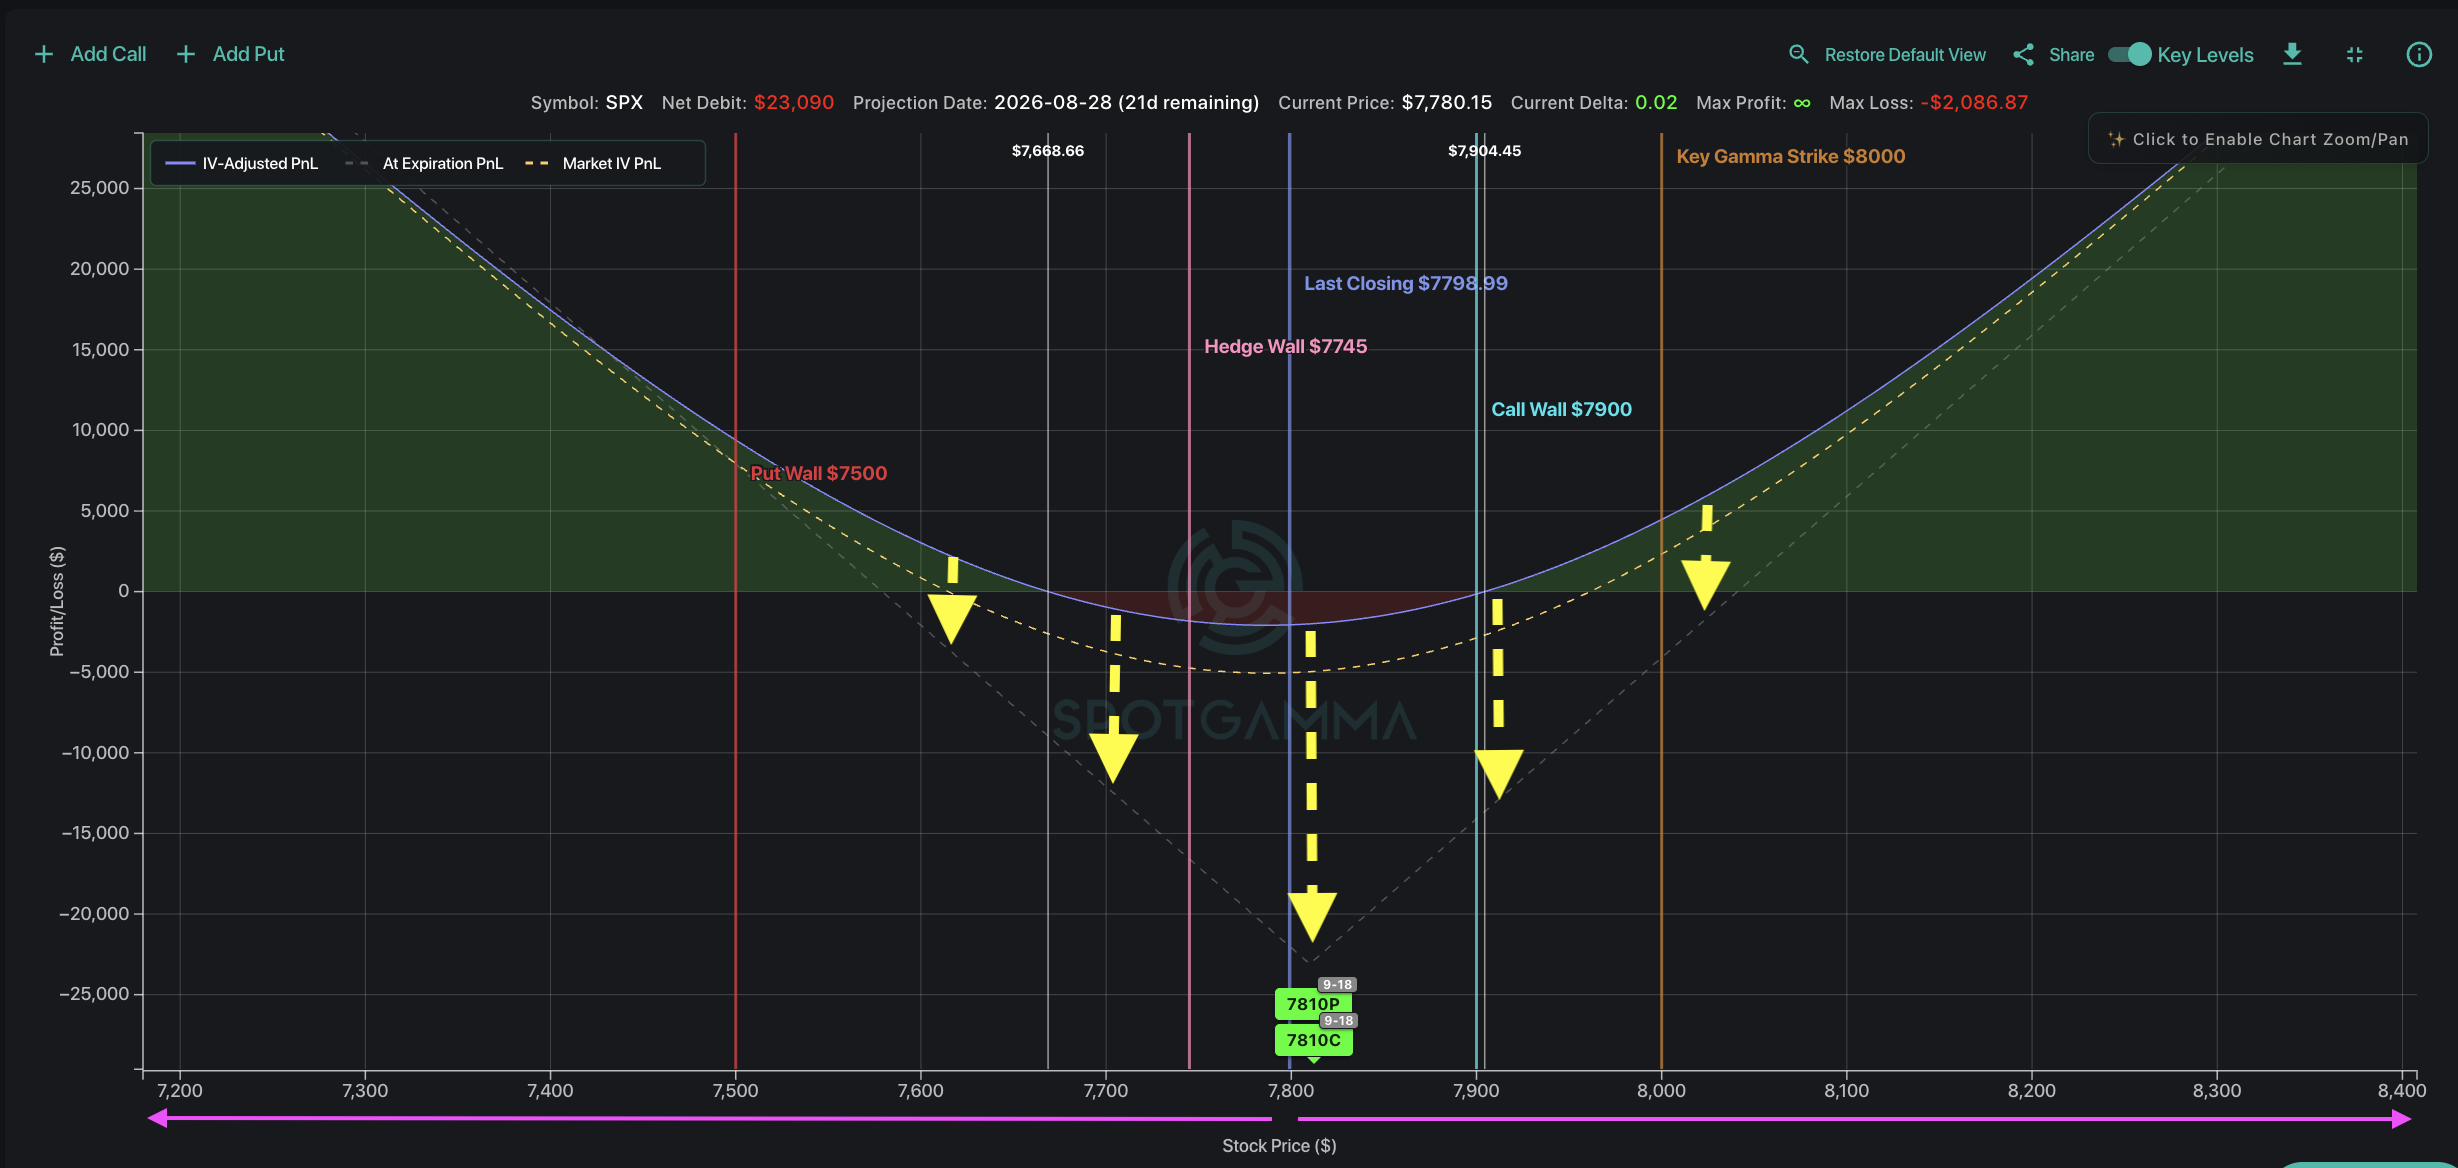
This trade looks particularly interesting as the August 28 expiration captures several high-powered catalysts ahead: August OPEX, NVDA earnings, and Kevin Warsh’s Jackson Hole speech. Strike selection is straightforward for straddles, as both the call and put is purchased at or very near the current underlying price.
What makes the long straddle work? When purchased at or near-the-money, options structures hold meaningful gamma. This means that the price of the options contract is highly sensitive to changes in the underlying price, and the contract’s premium can grow dramatically as price moves favorably. This long-gamma nature of the trade runs counter to theta decay, the carrying cost of owning optionality.
Entry timing is one of the most significant factors when buying a straddle. All else equal, lower starting IV means paying less premium for the optionality you are carrying into those events. Buying straddles when implied volatility sits near the low end of its range – ahead of a catalyst-dense window – could tilt the cost-benefit equation in the option buyer’s favor.
Directional Spreads: Combining Volatility with Positional Analysis
When traders hold a specific directional lean, lower implied volatility reduces the cost of expressing these views with options. Opening long spreads in particular can capture either upside of downside while reducing the direct upfront cost of the position. Examining the dealer gamma landscape can help traders understand the directional strategies which may be most viable.
Using TSLA as an example, our Synthetic OI model currently shows peak positive gamma directly below spot price. This is likely to provide a cushion on a move lower: dealers hedge by trading against price action in positive gamma environments, meaning dips are likely to be bought mechanically.
To the upside, the dealer gamma landscape shows negative gamma: in negative gamma environments, dealers pivot to hedge with price action. That means an upside break could travel faster and further as realized volatility accelerates.
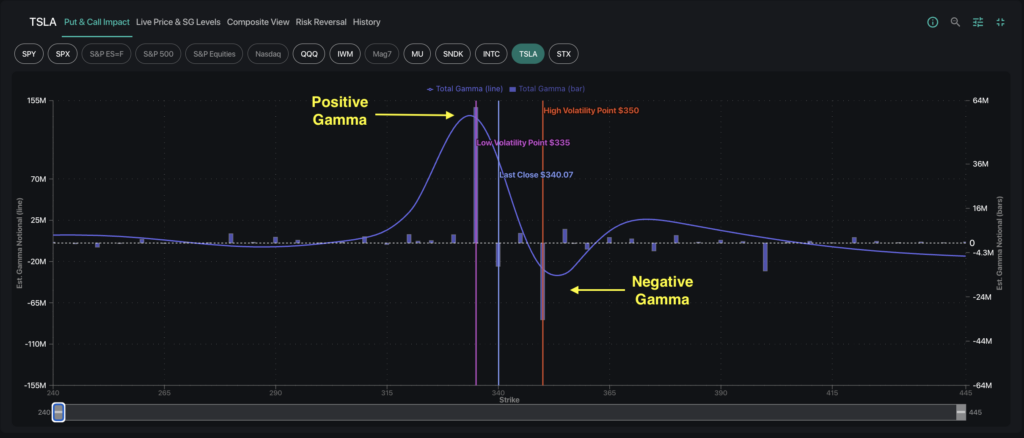
For TSLA, this asymmetry argues for structures such as long call spreads. These positions benefit from an upside move, while the positive gamma below spot helps identify potential areas of support for a trade entry.
The key takeaway for this week is that the current low-IV environment can shift the opportunities to structures that capitalize on a spike in volatility. With the VIX recently touching its lowest levels of the year even as the S&P 500 prints fresh records, next week’s OPEX followed by NVDA earnings and the Jackson Hole Symposium provide notable events traders can consider positioning around.