At the beginning of March with the market near ’22 lows, SpotGamma flagged two catalysts that could spark a rally.
The first was the March 16th FOMC and the second was a large, put heavy OPEX (go here to listen to our forecast posted on 3/11/22).
Entering into this time frame, our analyses suggested options liquidity providers [OLP] were short put options, hedged with short futures/stock. As a result, with the passage of these events, OLP’s would repurchase these short hedges, fueling what some metrics suggest was the “strongest rally since ’20” (see here for a full analysis).
From an S&P 500 perspective, the jump was ~6.5% off of March lows. This is quite similar to the Jan ’22 rally, which was also off of the back of a large options expiration and FOMC (1/21/22 & 1/26/22 respectively).
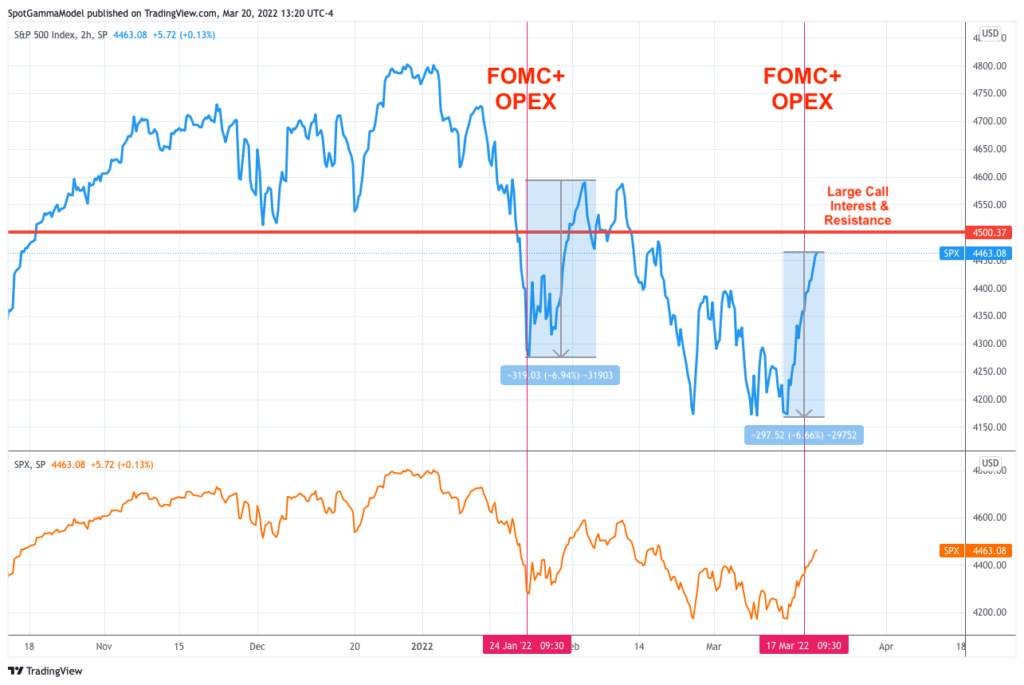
As we viewed that much of the recent rally was tied to large put options expiring 3/18, we now have concerns relating to the sustainability of the rally. For an extended move to continue, it’s our view that more fundamental buyers need to step in, taking the baton from hedging flows.
Through an options lens, that did not (and has yet to) happen.
Shown below are charts of customer order flow (i.e. retail, hedge funds & other buy-side) looking at the premium transacted through buying or selling options on a weekly basis. For all graphs, calls are shown in blue, and puts are in orange.
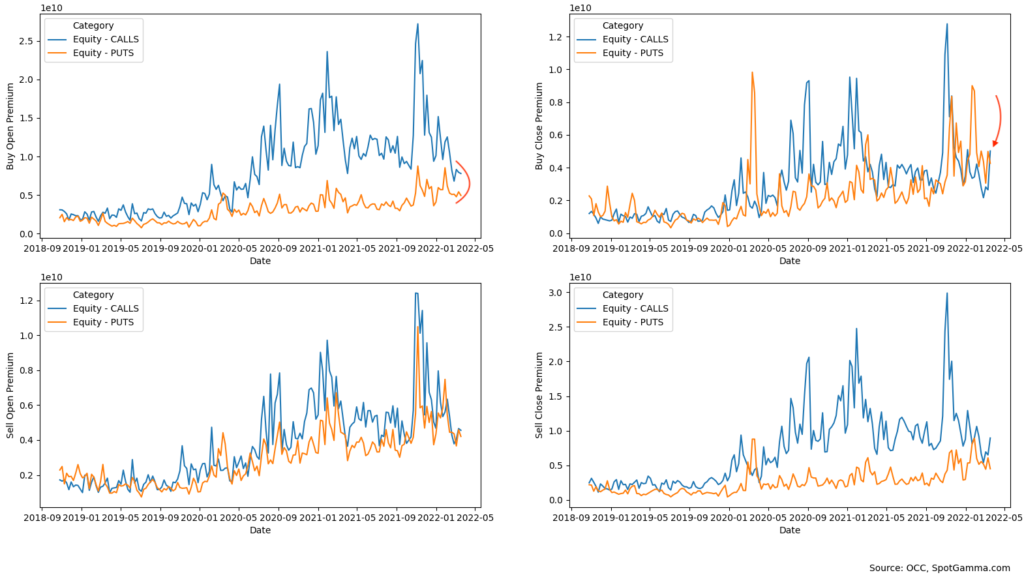
First, we look at equity order flow. The top-left chart shows the premium spent to buy equity options. It’s no secret that equity options have been a “weapon of choice” the past few years when traders sought to express a bullish view. However, the premium spent this past week buying equity call options was barely off of lows going back to 2020.
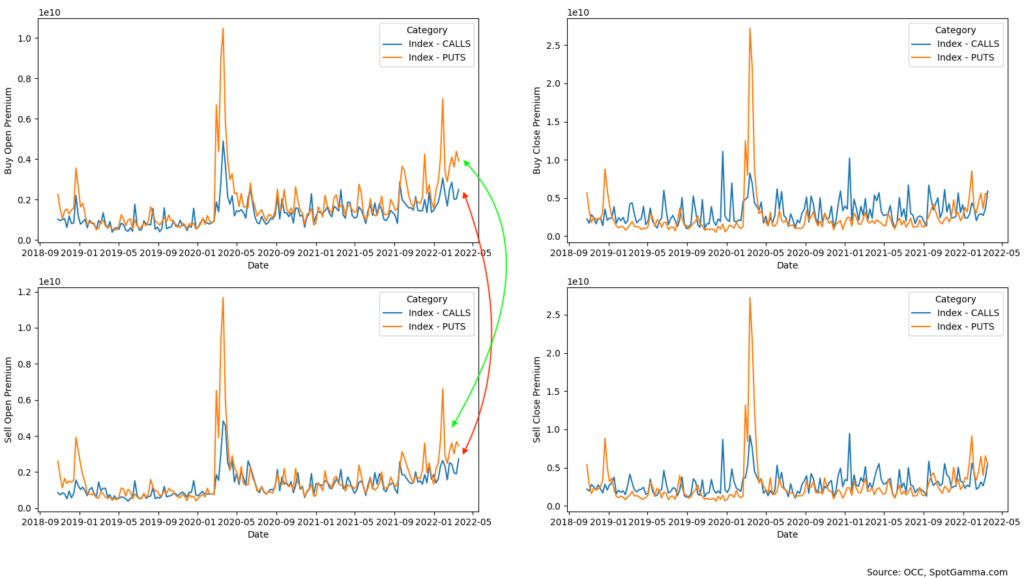
Next, we show the Index options flow (mostly SPX, as well as VIX, RUT, and NDX). Note that the premium transacted to buy calls (top left) is near highs going back to ’18. However, that is notionally equivalent to call options sold to open (bottom left). In essence, the index activity was neutral.
Finally, we’ve plotted the flow in ETFs (made mostly of SPY & QQQ options). This appears to be the only area of large call buying as shown at the top left. Note that there are many sharp spikes higher in call buying over time (ex: green arrows, top left & bottom left). Almost all of these spikes coincide with SPY dividend dates, one of which occurred this past Friday, March 18th.
In other words, it appears that these large flows are related to dividends. If these flows were linked to something such as quarterly hedging, you’d expect to see similar large spikes in the Index charts.
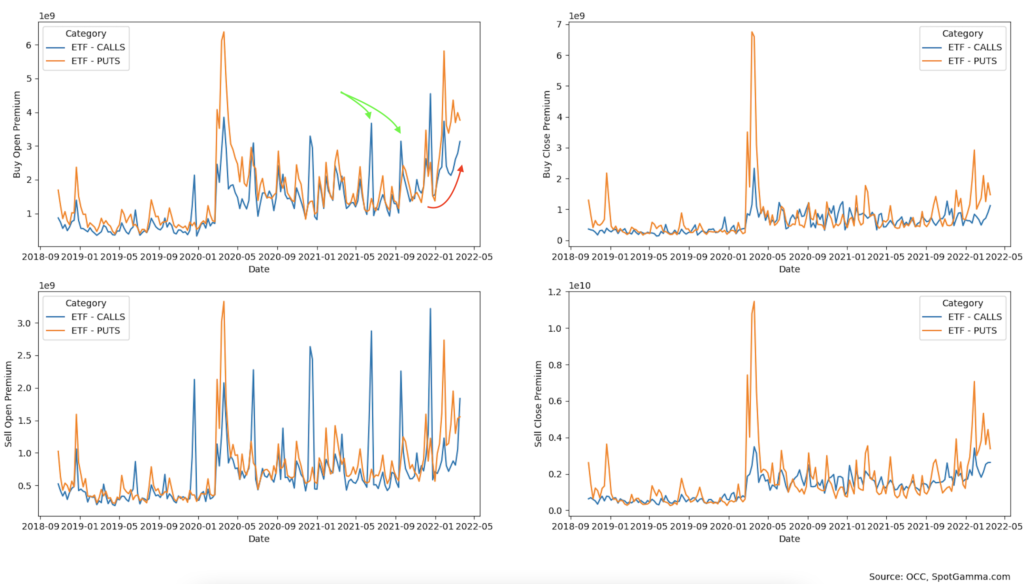
In summary, this data suggests that material long call buyers did not step in this past week, despite the large market rally. As a result, we’re concerned about the sustainability of this rally.
When traders purchase call options, it, in theory, leads OLP’s to immediately purchase the underlying equity (delta) – but it also imparts continued, incremental purchases (gamma) should the stock move higher. This, in our view, can help sustain bull runs. Therefore the lack of call buying reduces further upside demand.
It also dovetails with our view that the equity market is no longer well-hedged. Throughout March we’ve highlighted for our subscribers that large put positions have been suppressing market volatility despite large spikes in cross-asset volatility (i.e. commodities and credit markets).
Our models suggest that Friday’s expiration cleared more than 30% of the total S&P 500 put position. Given this, was there to be some exogenous event, participants’ demand for protection and rising volatility would be met with counterparty hedging pressures that may promote very fast moves lower.