Last week began with fear dominating market sentiment: analysts widely attributed Tuesday’s 2% SPX selloff to Greenland worries and tariff threats. As we pointed out in last weekend’s newsletter, traders had begun hedging against downside risk as put skew increased and volatility premiums rose. However, the quick turnaround back to SPX 6,900 seemed to erase any pent-up market anxieties. Starting Wednesday, the market experienced a vanna-driven rally as implied volatility declined and major indices resumed risk-on conditions.
The mechanics of a vanna rally are based on dealer hedging requirements. When implied volatility decreases — like we saw starting on Wednesday — put options lose value. As the value of puts decreases, the hedging requirement associated with each contract also falls, meaning dealers can cover their short hedges. This short covering in turn pushes the market upward. Last week’s volatility crush and subsequent vanna-driven rally carried SPX from lows near 6,790 to comfortably break above 6,900.
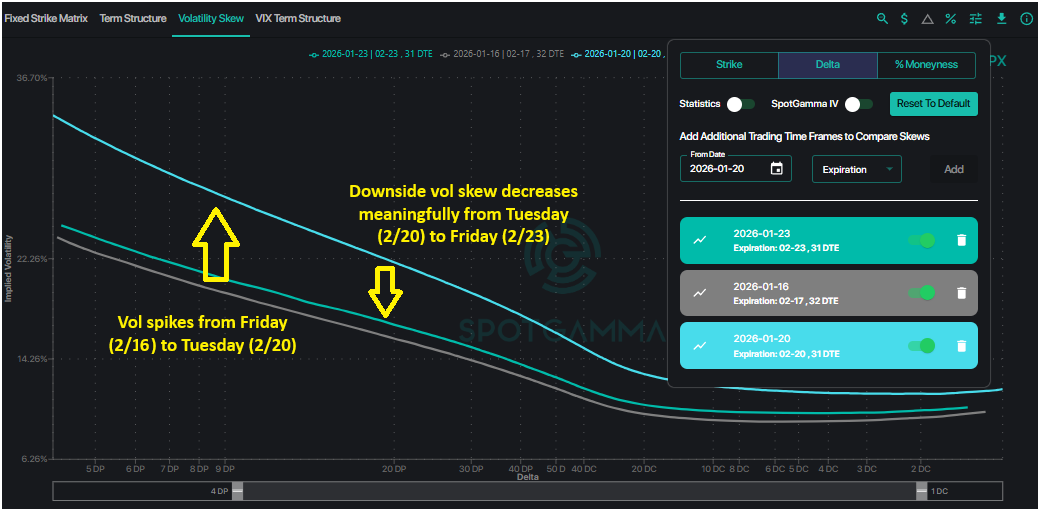
Interestingly, Tuesday’s volatilty expansion coincided with the first trading day after OPEX (1/16). This past monthly expiration saw largely positive gamma positions expire, giving way to negative gamma and the more fluid price action we observed at the start of last week. VIX Expiration on Wednesday morning (1/21) marked the turnaround point, where largely negative gamma positions expired within the VIX complex.
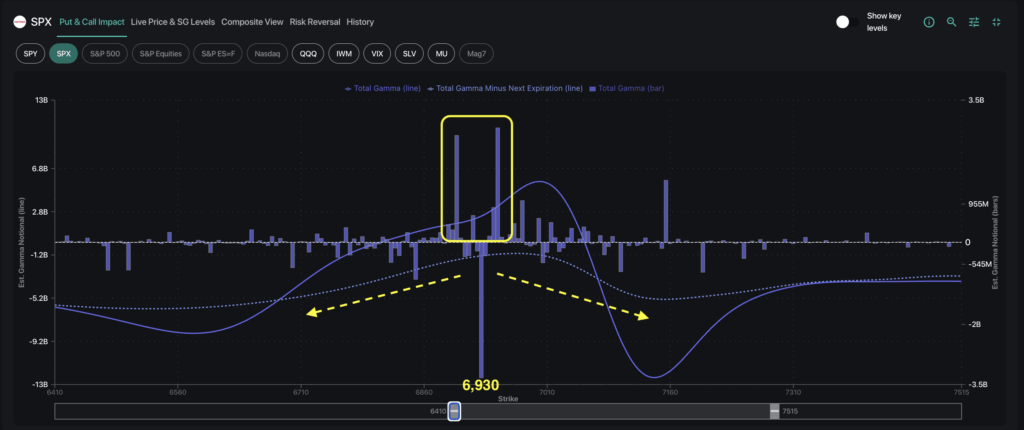
We now find ourselves back inside the SPX 6,900–6,950 consolidation range as the market heads into tech earnings and FOMC. The dealer gamma profile has flipped positive once again, bounded by two large strikes at 6,900 and 6,950. We do note that this positive gamma regime is still driven by short-dated volatility sellers, which makes it more fragile and subject to rapid intraday shifts as positioning evolves. Should 0DTE vol sellers stay out of the market, SPX is left vulnerable to renewed two-way volatility.
What Does the Options Market Tell Us About Big Tech Earnings?
Next week brings a heavy earnings slate, with four of the Mag 7 reporting: Tesla, Microsoft, Meta, and Apple. Using SpotGamma’s Compass, we can analyze the market’s expectations of direction and volatility for each individual name.
Individual tech stocks showed dispersion in terms of positioning: TSLA and AAPL appear relatively balanced, with neutral Risk Reversal Ranks and low IV Rank. MSFT and META are each skewed toward the call side, with higher IV Rank, though not at extreme levels. Within semiconductors, memory stocks such as SNDK and WDC stand out with highly elevated implied volatility.
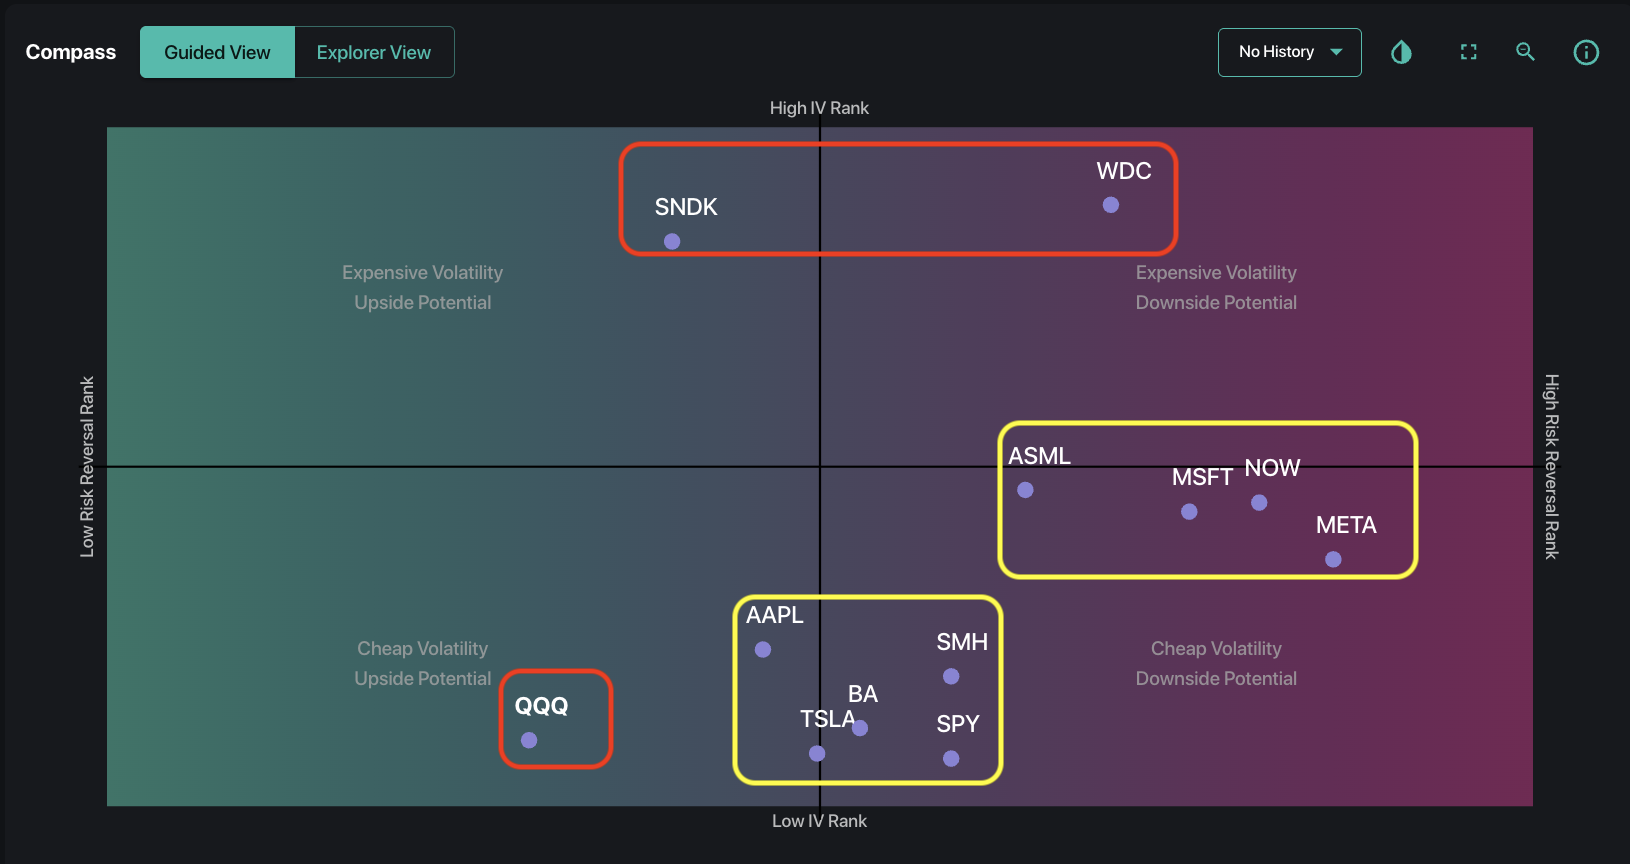
Taking a look at QQQ, we see that the ETF is notably skewed towards puts, contrary to most individual tech names shown above. This suggests elevated hedging activity ahead of major tech earnings.
Volatility skew for QQQ appears compressed relative to its 90-day range (shaded area on the chart below). Forward implied volatility remains elevated through next week at 25% vs. spot IV at 18%, which suggests the options market is not fully pricing in a volatility-inducing event. Given this, there may be jump potential around the Wednesday-to-Thursday timeframe.
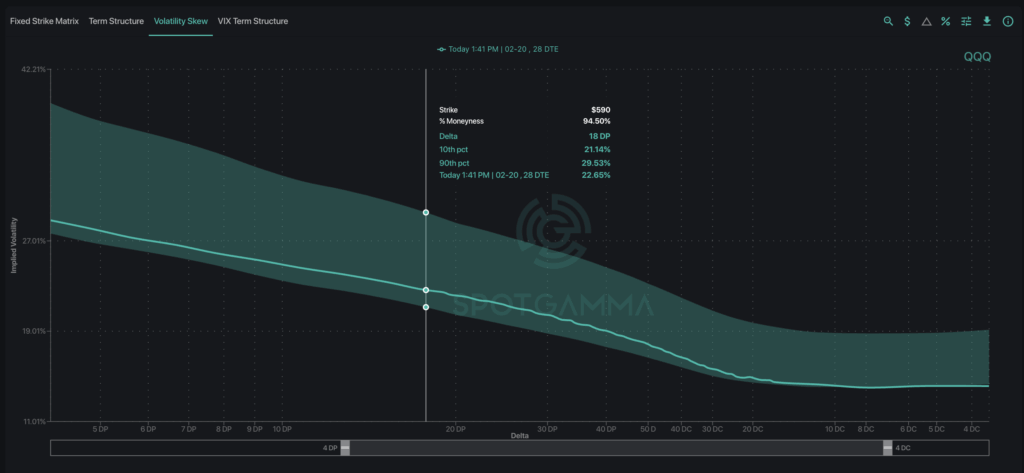
From a gamma perspective, QQQ remains negative gamma across the curve, meaning dealer hedging flows would likely amplify price movement in either direction. Significant put exposure at the 590 strike (dealers short ~178k put contracts) indicates that there is notable downside hedging embedded in the options structure.
The Week Ahead: FOMC Coincides With Earnings
We see a packed week ahead for markets as earnings coincide with FOMC and major data prints on the schedule:
Tuesday (1/27):
- Macro: Consumer Confidence, ADP Employment
- Earnings: UNH, RTX, BA, UNP, NOC, UPS, GM, TXN, STX
Wednesday (1/28):
- Macro: FOMC Rate Decision
- Earnings: MSFT, META, TSLA, IBM, NOW, ASML, SBUX
Thursday (1/29):
- Macro: Jobless Claims
- Earnings: AAPL, V, MA, WDC, SNDK, CAT, BX, LMT, HON
Friday (1/30):
- Macro: PPI
- Earnings: XOM, CVX, AXP, VZ, REGN, AON
The multiple economic data points, Powell’s messaging on future rates, and mega-cap earnings could each shift narratives quickly. Tactically, we remain bullish above SPX 6,890. However, with COR1M breaking into risk-off territory (≤8) last week, we note that hedging via cheap VIX call spreads may present an asymmetric risk-reward ratio for the week ahead. As always, we continue to watch HIRO and TRACE to monitor intraday positioning shifts as they unfold.
Now Available: SpotGamma’s Q4 2025 Report Card
See How SpotGamma Traders Navigated Last Quarter’s Market Dynamics
In Q4 2025, we observed a highly compressed market environment defined by extreme bullish positioning, basement-level realized volatility, and sharp catalytic moves that vindicated SpotGamma’s risk alerts.
The Q4 2025 Report Card shows how our community navigated market shifts — from holiday rallies to complex expiration dynamics. View the full breakdown to see how SpotGamma’s pre-market insights translated into real trading edge last quarter.
