• Skip to main content
  • Skip to primary sidebar

SpotGamma™

S&P 500 Stock Market Gamma Trading Levels Based on Options Open Interest

  • About
  • Pricing
  • Academy
  • Resources
    • Tool Demos
    • Case Studies
    • Blog
    • Support Center
    • Daily Report
    • Free Trading Tools
      • Opening Setup Free Report
      • Options Profit Calculator
      • SPX Gamma Exposure
      • Implied Earnings Moves
    • Free Training
    • Report Card
  • Login

theta decay

Sep 13 2026

Hedging Against a Volatility Spike: VIX Calls vs. SPX Puts

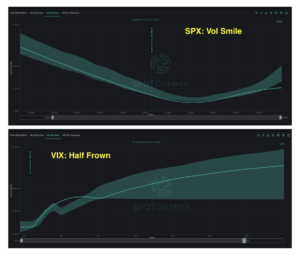
Two SpotGamma charts show SPX vol smile and VIX half frown of implied volatility versus strike.

A series of major market catalysts arrive next week: the FOMC rate decision, VIX Expiration, and September Triple Witching OPEX. Options positioning suggests that institutions are already paying up for event protection. Over the past two weeks, we have observed notable VIX hedging activity in our daily FlowPatrol reports. This included several particularly significant positions: […]

Written by Sherry An · Categorized: Market Analysis, SpotGamma Weekly · Tagged: dealer gamma, Gamma Exposure, implied volatility, Options Calculator, options positioning, options skew, spotgamma weekly, SPX puts, theta decay, Triple Witching OPEX, VIX calls, Volatility Skew

Sep 07 2026

AI Infrastructure Runs Hot into September
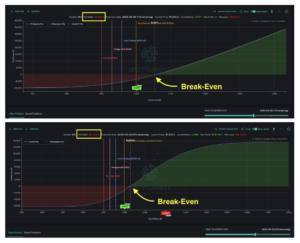
Two profit/loss charts for MU stock showing break-even points around $1,000 strike with expiration on 2026-09-29.

August closed with robust corporate earnings, and nowhere was that clearer than in the AI trade stocks. Last week’s standout report came from Dell (DELL), which jumped 16% after beating estimates and raising guidance. Dell is a leading server provider for AI data center infrastructure. Its results echoed what Nvidia (NVDA) showed a week earlier: […]

Written by Sherry An · Categorized: Market Analysis, SpotGamma Weekly · Tagged: AI data center stocks, bull call spread, call skew, dealer gamma, DELL earnings, Gamma Exposure, implied volatility, Options Calculator, options positioning, options skew, semiconductor rotation, spotgamma weekly, theta decay

Aug 16 2026

How Traders Can Play Low Volatility Environments
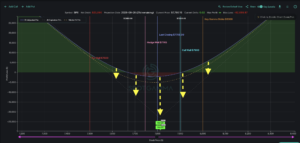
SPX options payoff diagram showing profit/loss curves with key strike levels and walls marked between $7,500-$8,000.

The S&P 500 has spent much of the summer grinding steadily higher to achieve record highs. Meanwhile, implied volatility has reset toward yearly lows for both major indices and many single stocks. When options become this cheap, the price of volatility itself can open new trading opportunities. The Term Structure chart reveals current SPX at-the-money […]

Written by Sherry An · Categorized: Market Analysis, SpotGamma Weekly · Tagged: call spreads, contango, dealer gamma, Gamma Exposure, implied volatility, long straddle, low implied volatility strategies, options convexity, options positioning, options skew, spotgamma weekly, SPX term structure, synthetic gamma, theta decay

Primary Sidebar

SpotGamma-Subscriber-Signup-Banner

  • META Rewrites the AI Trade
  • Salesforce: A $1 Million Insider Buy Near a Key Options Level
  • Erasca’s November Catalyst: Promising Data, High Expectations and Strategic Optionality
  • NDX Call Skew Has Room While S&P Vol Contracts: Kochuba on tastylive
  • Costco Earnings: What Shoppers—and Options—Are Telling Us
  • youtube
  • x
  • Privacy Policy
  • Disclaimer
  • Terms & Conditions
  • Support Center
  • Media
  • Contact Us

©2026 TenTen Capital LLC DBA SpotGamma

All SpotGamma materials, information, and presentations are for educational purposes only and should not be considered specific investment advice nor recommendations. Futures, foreign currency and options trading contains substantial risk and is not for every investor. An investor could potentially lose all or more than the initial investment. Risk capital is money that can be lost without jeopardizing one's financial security or lifestyle. Only risk capital should be used for trading and only those with sufficient risk capital should consider trading. Past performance is not necessarily indicative of future results. Testimonials appearing on this website may not be representative of other clients or customers and is not a guarantee of future performance or success.

View Full Risk Disclosure