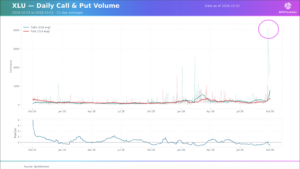
With 10-year treasury yields now at two-decade highs, the topic of rates has dominated markets. Rising rates adds meaningful stress to the economy at large — creating both risk and opportunity for traders. The market’s most rate-sensitive corners have taken the brunt of the damage. Small caps (IWM), utilities (XLU), homebuilders (ITB), and industrials (XLI) […]
options skew
META Rewrites the AI Trade
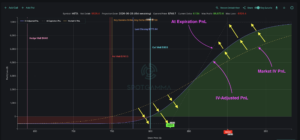
Meta’s new Muse AI Agent has done what a year of capex headlines could not: it has convinced the market that the company’s $200 billion investment in AI has a consumer-facing payoff. META rallied 13% over the past week and pushed toward 52-week highs as the personal agent app topped the download charts. The enthusiasm […]
Quiet Oil Options Mask Tail Risk
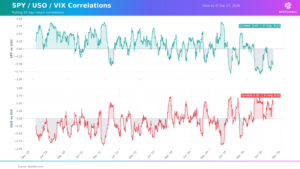
Oil prices drove headlines this past week amidst flare-ups in the ongoing Iran conflict. WTI crude broke above $100 on September 15, and diesel fuel hit an all-time high of $6.31 per gallon. The mystery is that despite the price spike, the options market for oil remains unusually subdued. The CBOE Crude Oil Volatility Index […]
Hedging Against a Volatility Spike: VIX Calls vs. SPX Puts
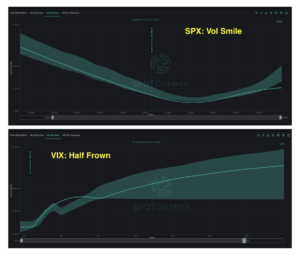
A series of major market catalysts arrive next week: the FOMC rate decision, VIX Expiration, and September Triple Witching OPEX. Options positioning suggests that institutions are already paying up for event protection. Over the past two weeks, we have observed notable VIX hedging activity in our daily FlowPatrol reports. This included several particularly significant positions: […]
AI Infrastructure Runs Hot into September
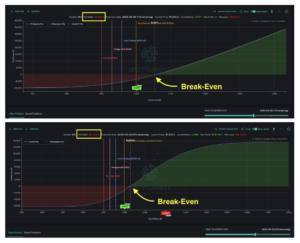
August closed with robust corporate earnings, and nowhere was that clearer than in the AI trade stocks. Last week’s standout report came from Dell (DELL), which jumped 16% after beating estimates and raising guidance. Dell is a leading server provider for AI data center infrastructure. Its results echoed what Nvidia (NVDA) showed a week earlier: […]
Software Earnings Reignite Risk Appetite
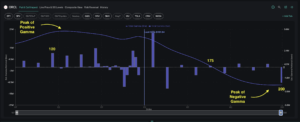
Market sentiment was mixed last week following NVDA earnings and Jackson Hole. While NVDA’s solid outlook pushed the market to within inches of all-time highs, Warsh’s hawkish tone seemed to increase the probability of a September rate hike. Throughout August, the S&P 500 has closed in a narrow 2.6% band (SPX 7,600 – 7,800). The […]
Volatility Has Compressed. What Happens Next?
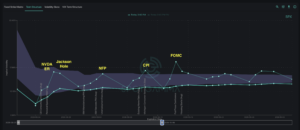
The S&P 500 pulled back slightly last week, and the market’s recent volatility compression phase appears ready for a reset. With earnings season largely over, both index and single stock volatility have dropped from the elevated levels that prevailed earlier this summer. Our pre-market Founder’s Note on Friday explained how substantial short-options positions cleared with […]
How Traders Can Play Low Volatility Environments
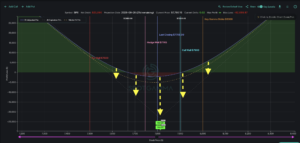
The S&P 500 has spent much of the summer grinding steadily higher to achieve record highs. Meanwhile, implied volatility has reset toward yearly lows for both major indices and many single stocks. When options become this cheap, the price of volatility itself can open new trading opportunities. The Term Structure chart reveals current SPX at-the-money […]
Welcome to the Summer Melt-Up
The S&P 500 delivered a high octane four-day run last week, establishing all-time highs with a 6% rise from weekly lows. Shifting interest rate expectations, easing Middle East tensions, and strong corporate earnings powered the dramatic rally. The sharp surge brought out notable divergences across the tech space. Software outperformed the broader market, with strong […]