Following last week’s ceasefire announcement, the S&P 500 lifted 3% from roughly 6,550 to 6,800. On the surface, this rally looked like a meaningful shift toward risk-on sentiment as implied volatility collapsed rapidly across all expirations. Similarly, VIX plummeted below 20 for the first time in four weeks, marking one of its largest single-day declines ever.
Yet as our pre-market Founder’s Note flagged the next morning: “Vol crush was a major driver of equity returns…This view matters vs. believing the market is/was pricing in ‘all clear’ from a macro/fundamental perspective.”
A closer inspection of the mechanics behind last week’s rally points to vanna as a key culprit. Vanna measures how shifts in implied volatility (IV) change an options delta, which is used by dealers to measure how they hedge their exposure.
When IV drops sharply in a “vol crush” scenario, the delta shrinks for outstanding put contracts, which means dealers no longer need to short as many shares / futures to stay hedged. They buy back those assets, which pushes prices higher.
Last week, this dynamic became highly significant: dealers had been generally short puts over the past month as traders leaned into downside protection. As IV decreased, this put-heavy positioning no longer needed to be hedged as aggressively by dealers, leading them to buy back their shorts.
Adding to this dynamic was the prevailing negative gamma regime. In negative gamma, dealer hedging flows amplify price movements in either direction. As traders chase calls into the upside move, dealers who are short these calls need to buy more futures as market rallies, the gamma dynamics amplify the move to the upside.
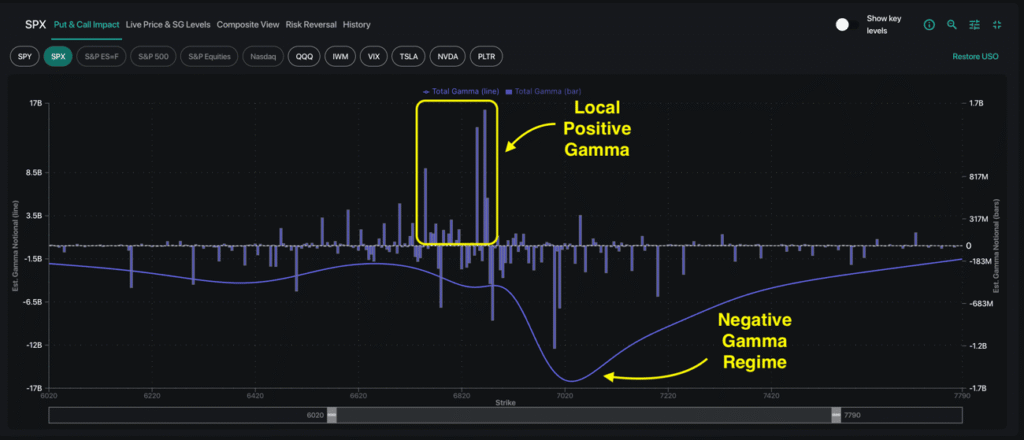
The key takeaway is this: a vanna-driven rally is not a fundamental “all clear” signal. It’s a mechanical response to volatility compression.
Should implied volatility re-expand — triggered by renewed macro stress, a geopolitical flare-up, or a disappointing economic event — those same dealer hedging flows hold the potential to reverse rapidly. In a negative gamma environment, those reversals can accelerate with intensity.
Bullish Flows Are Short-Dated, Defensive Flows Are Not
Beneath the headline rally, the structure of options positioning tells a more cautious story. Much of last week’s bullish activity was concentrated in short-dated expirations. One notable trade saw approximately twenty-five thousand SPX 0DTE 6,830 calls traded with spot at 6,775. This marked a tactical, very short-dated bet — not an expression of longer-term bullish conviction.
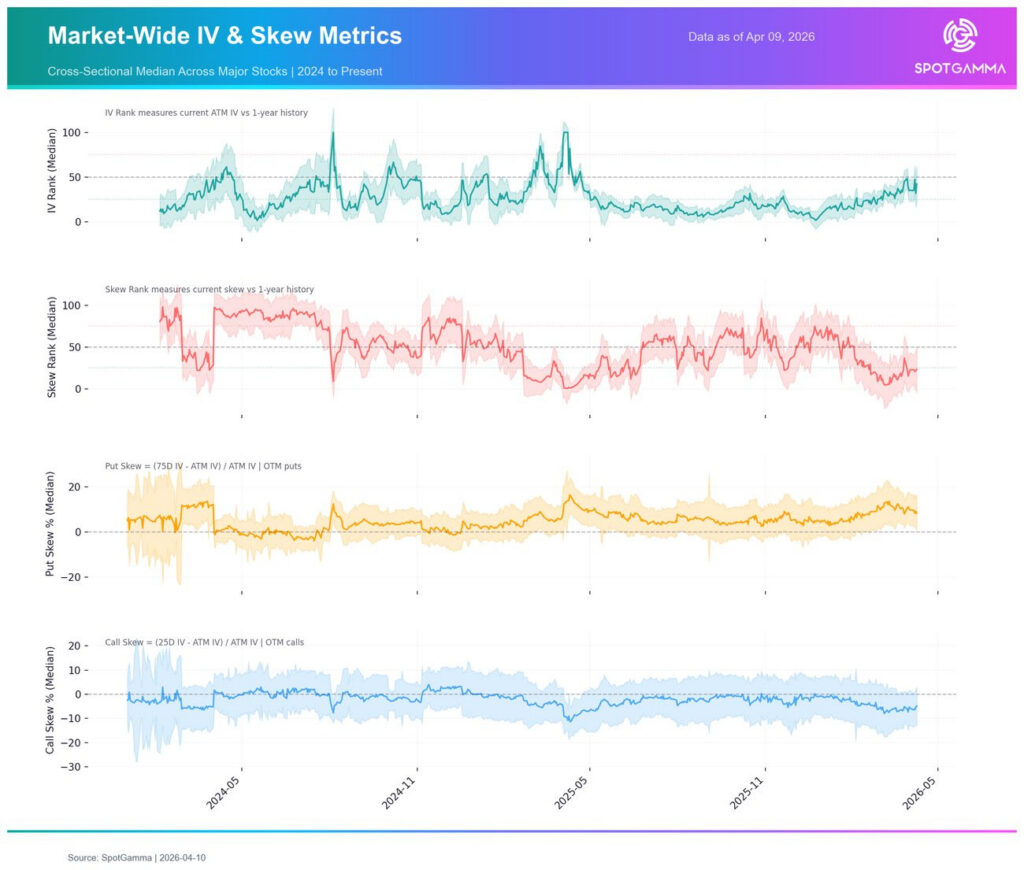
Meanwhile, longer-dated positioning remains defensive. A Skew Rank below 50% (second red line below) indicates puts are still expensive relative to calls, reflecting persistent demand for hedges. This suggests market participants are not yet fully convinced of the rally’s staying power.
Single Stocks Show Interesting Volatility Plays
While index-level implied volatility appears to have stabilized, single stocks continue to offer actionable setups.
In last Monday’s Founder’s Note, we mentioned single stock implied volatility (IV) is relatively cheap compared with index IV, which can create asymmetric setups. This dispersion trade played with Mag7 and semi stocks showing robust performance compared to major indices for the past week: NVDA +7%, MU+13%, AMZN+14%, AVGO +18%.
Take NVDA as a prime example: the current implied volatility (teal line) is still relatively low compared to the 60-day range (shaded area). IV is most notably compressed around the 150 strike, meaning options prices are significantly lower here compared to the last two months.
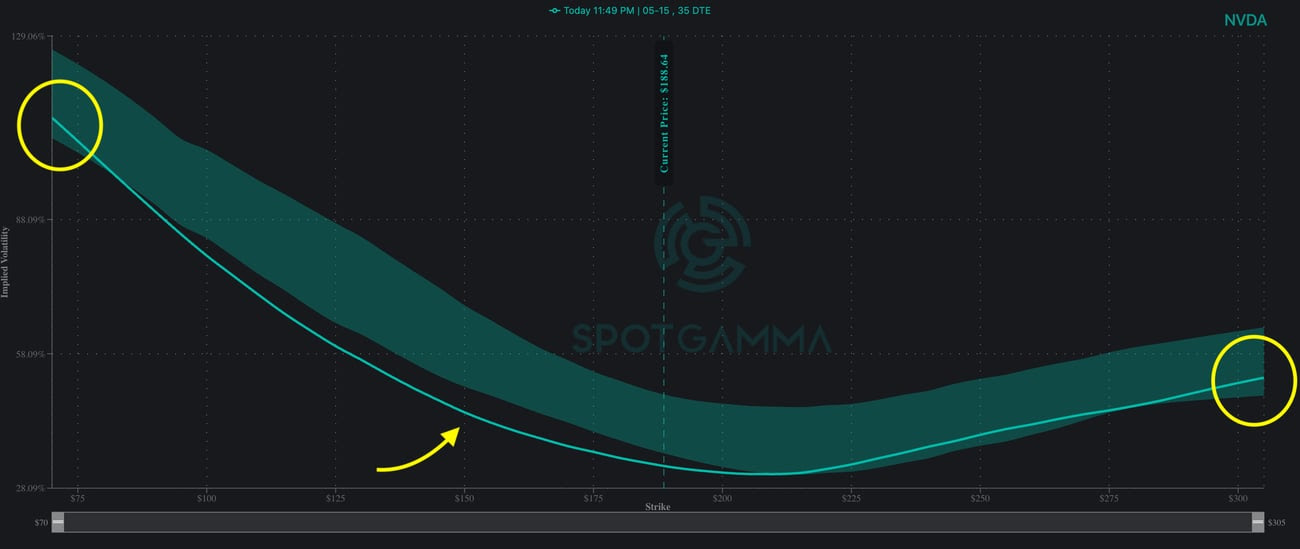
Interestingly we also saw 57,000 put-selling contracts at the 150 level, while the tail options saw buying activity. For traders watching single stocks into earnings season, we encourage a healthy focus on implied vols to gauge the relative price of options.
The Week Ahead: Earnings Season + Expiration Flows
The SPX implied volatility Term Structure has reset meaningfully lower relative to its recent range. The upward-sloping curve indicates near-term IV is lower than longer-dated IV, signaling somewhat more normalized conditions.
Major events this week include VIX expiration (4/15) and monthly OPEX (4/17). These key dates can drive meaningful changes in dealer positioning and gamma exposure. In addition, earnings season begins with the major banks and NFLX reporting.
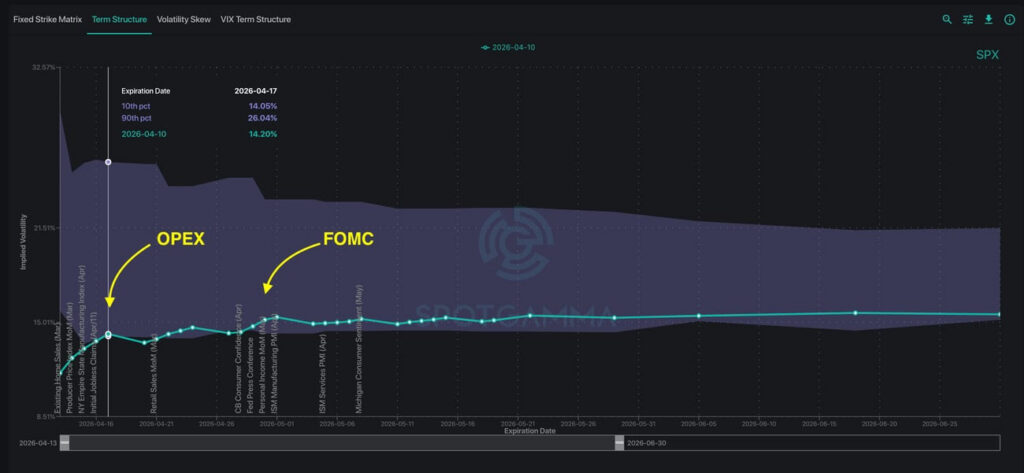
The combination of large options expirations and the start of earnings season introduces the potential for volatility to climb after achieving monthly lows. Given the current negative gamma backdrop, data from the options market suggests traders remain prepared for sudden shifts throughout the upcoming week.