• Skip to main content
  • Skip to primary sidebar

SpotGamma™

S&P 500 Stock Market Gamma Trading Levels Based on Options Open Interest

  • About
  • Pricing
  • Academy
  • Resources
    • Tool Demos
    • Case Studies
    • Blog
    • Support Center
    • Free Daily Report
    • Free Trading Tools
      • Options Profit Calculator
      • SPX Gamma Exposure
      • Implied Earnings Moves
      • Volatility Ranking
    • Free Training
    • Report Card
  • Login

Nov 17 2020

TSLA Added to the S&P500

Last night the S&P announced that TESLA (TSLA) would be added to the S&P500 (SPX) Index by Monday 12/21. What this effectively means is that anyone that has funds (pensions & other large asset managers) indexed to the S&P500 will need to purchase TSLA stock, and will sell whichever stock(s) TSLA is replacing(TBD). As TSLA has such a large market cap this is a very large notional change which likely requires a significant amount of the TSLA float.

For funds that are linked to the S&P500 its important that they own the stock on the close of the date that it is added. This is so that they match the S&P500 index to which they are benchmarked. The way they often do this is to purchase shares from a dealer that guarantees them the closing price of Friday 12/18. Therefore the dealers may be purchasing the stock ahead of time so that they can sell (aka “facilitate”) the required shares to those index funds at the close. Again, dealers buy the TSLA shares in the day(s) leading up to the TSLA S&P add, then sell those shares to the large funds at the close of 12/18 (when TSLA is officially added to the S&P500).

The mechanics of the S&P Index add are a bit slower moving than the feverish call buying by the likes of r/wallstreetbets. The call position coming into 11/17 in TSLA is less aggressive compared to August positioning, with the 500 strike being the largest call level. As you can see in the chart below the amount of call gamma(blue line) is roughly equivalent to the put gamma (orange line).
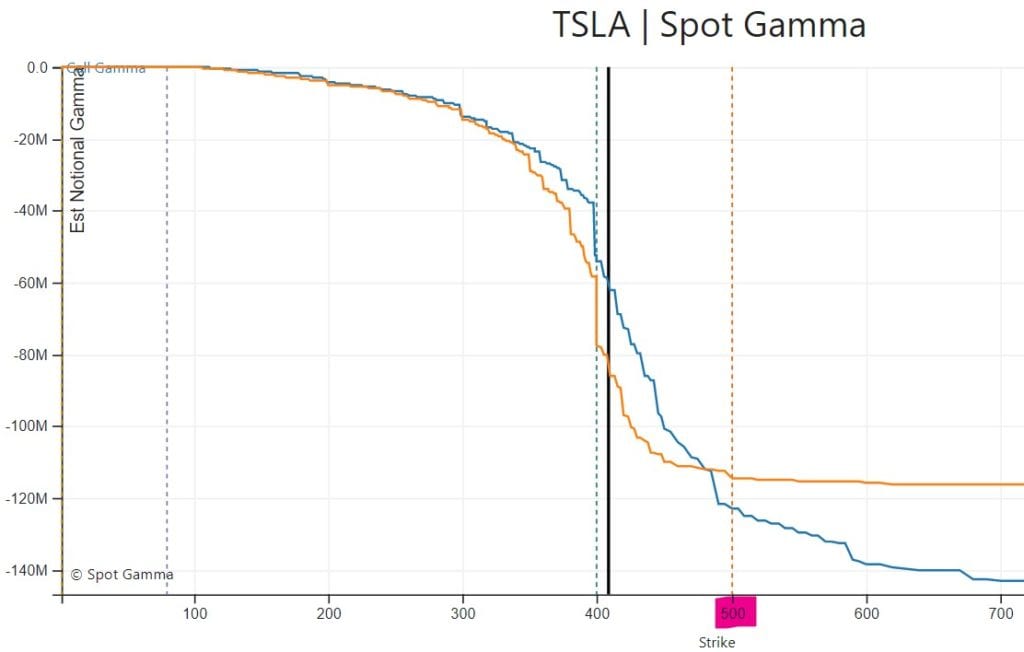
TSLA November Options Gamma

If call positions were much larger than puts we would see that blue line extend far below the orange line, as it did in August (chart below) during the massive move higher in TSLA stock. The “gap” between the call and put gamma in August implied that there were a lot more calls at strikes overhead, and this drove dealers to aggressively buy the stock as it went higher.
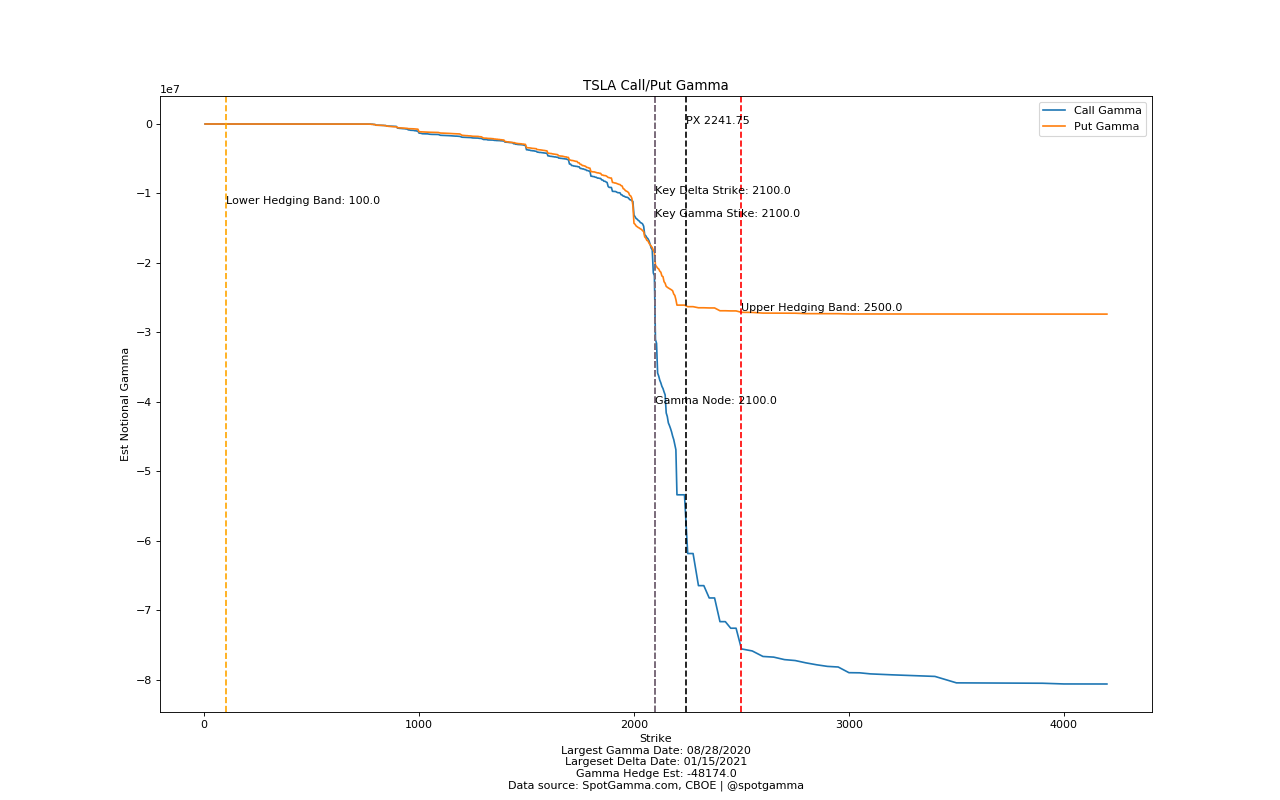
TSLA August Options Gamma

Our assumption, here in November, is that call buyers will now be aggressively stepping in as a result of the S&P add to shift a divergence between call & put gamma. It will be interesting to see if the stock can reach that large $500 strike as various players step in ahead of the large index add.

We see two sources of buying that may now materialize:

  1. Call buyers and other short term traders now
  2. Dealers and Index funds into 12/18

We’ll post an updated TSLA options chart tomorrow.


If you like these charts, consider a trial of our EquityHub.

UPDATE:

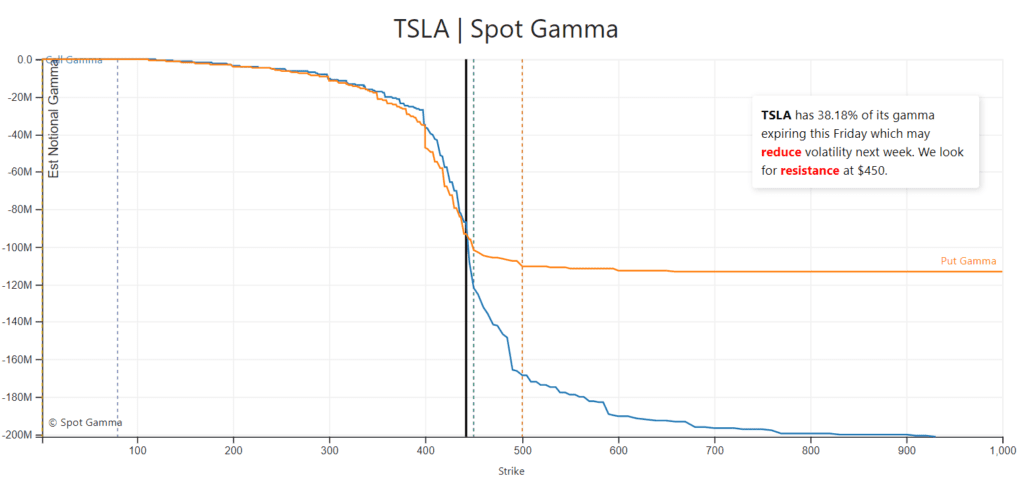
Despite the 950k call volume yesterday it looks like the net OI add is about 200k. Regardless todays position looks more bullish than yesterdays, and the stock seems to be shifting a bit higher.
Share This Article

  • Share
  • Twitter
  • LinkedIn
  • Reddit
  • Facebook

Written by SpotGamma · Categorized: Market Analysis, Stock · Tagged: S&P500, TSLA

Don’t have an account with SpotGamma?

Choose the plan you want today to view unique support and resistance levels, access Founder’s Notes and expert commentary, daily trading ranges, and entrance into our private Discord.


Primary Sidebar

Related Resources

  • How Traders Can Play Low Volatility Environments

    How Traders Can Play Low Volatility Environments

    August 16, 2026
  • Welcome to the Summer Melt-Up

    Welcome to the Summer Melt-Up

    August 9, 2026
  • The Machine Ran on Call Skew: What MSTR’s Dead Volatility Surface Says About Strategy — and Bitcoin’s Missing Bid

    The Machine Ran on Call Skew: What MSTR’s Dead Volatility Surface Says About Strategy — and Bitcoin’s Missing Bid

    August 3, 2026
  • The New Normal in Volatility Takes Shape

    The New Normal in Volatility Takes Shape

    August 2, 2026
  • Anatomy of a Margin Call: How Situational Awareness LP Unwound a $20 Billion AI Book in One Trade

    Anatomy of a Margin Call: How Situational Awareness LP Unwound a $20 Billion AI Book in One Trade

    July 30, 2026
  • youtube
  • x
  • Privacy Policy
  • Disclaimer
  • Terms & Conditions
  • Support Center
  • Media
  • Contact Us

©2026 TenTen Capital LLC DBA SpotGamma

All SpotGamma materials, information, and presentations are for educational purposes only and should not be considered specific investment advice nor recommendations. Futures, foreign currency and options trading contains substantial risk and is not for every investor. An investor could potentially lose all or more than the initial investment. Risk capital is money that can be lost without jeopardizing one's financial security or lifestyle. Only risk capital should be used for trading and only those with sufficient risk capital should consider trading. Past performance is not necessarily indicative of future results. Testimonials appearing on this website may not be representative of other clients or customers and is not a guarantee of future performance or success.

View Full Risk Disclosure