Fundamentals
Broadcom (AVGO) is the most important remaining AI hardware earnings report of the week, providing investors with a different read on AI spending compared to Nvidia. Nvidia tells us about demand for general-purpose GPUs, while Broadcom tells us about custom AI accelerators, networking, hyperscaler silicon programs, and the increasingly competitive threat to Nvidia from in-house ASICs.
Broadcom reports fiscal Q3 2026 after the close Wednesday, September 2, with the call at 5:00 p.m. ET. AVGO is currently trading around $369 today, roughly 25% below its June high, meaning expectations have already reset considerably since its last earnings disappointment.
Broadcom itself guided Q3 revenue to approximately $29.4 billion and AI semiconductor revenue to $16 billion, up more than 200% YoY. Management also guided software to about $8.9 billion and warned consolidated gross margin would decline toward 74% as AI semiconductors have a lower margin than the software mix. (Source: Broadcom Investor Relations)
4 Key Metrics Investors Will be Watching
1. Q4 AI semiconductor guidance
Broadcom previously laid out a roughly $56B FY2026 AI revenue trajectory. Q1 generated $8.4B, Q2 $10.8B and Q3 is guided to $16B. That totals $35.2B, mathematically implying approximately $20.8B of Q4 AI revenue to reach $56B.
- $21B+ Q4 AI guide: clearly bullish.
- $20–21B: acceptable/roughly expected.
- <$20B: likely disappointing.
- $22B+ plus stronger FY27 commentary: potentially a major upside catalyst.
2. The FY2027 “$100B+” AI target
This is arguably even more important for valuation. Broadcom has said AI semiconductor revenue should exceed $100B in fiscal 2027. In June, AVGO’s stock was punished despite enormous growth partly because management reiterated rather than materially raised the longer-term AI outlook. (Source: Investing.com)
3. AI bookings/backlog
Broadcom previously disclosed more than $30B of AI bookings against $10.8B shipped in Q2. That’s nearly a 3:1 bookings/shipment ratio. If that ratio remains extremely strong, it supports 2027 visibility.
4. Google/custom ASIC competition
Marvell recently announced a major Google custom-chip relationship, raising questions over whether Broadcom could lose some future share at Alphabet. Marvell nevertheless said much of the revenue impact from that deal won’t arrive until fiscal 2029. (Source: Reuters)
Technicals
AVGO now has a market cap of $1.75 trillion and is up only +7% YTD after a recent slide lower since its last earnings report 3 months ago. The positive here is that a lot of concern is discounted now from that more lukewarm outlook in June.
The correction off the parabolic highs of 495 have retraced into the 200 day moving average, providing a nice zone of support for longer term investors to consider exposure in the company that is still set to grow revenues north of +60% into 2027. The chart below also shows price stabilizing right near the one year point of control (POC) and AVWAP. (Source: Trendspider)
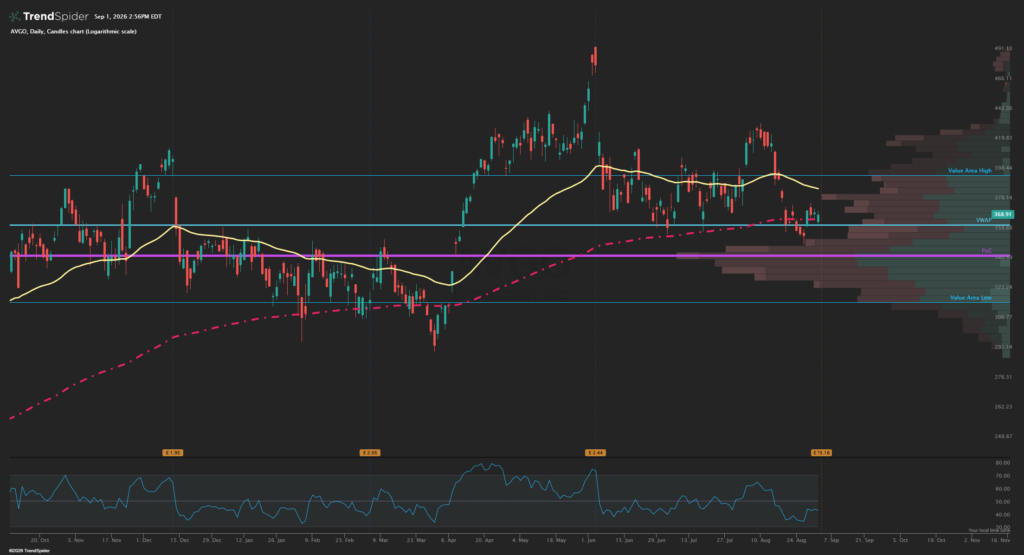
AVGO daily chart showing price near the 200 day EMA (red dashed line) after retracing from summer highs.
Analyst Sentiment
Looking at Koyfin estimates, Wall Street analysts are bullish on the stock with an average analyst target of $525. AVGO currently has 45 Buy ratings and just 4 Holds and zero Sell ratings. Overall bullish sentiment from the analyst community but price action is nearly 40% below that average price target, possibly implying the market has punished the stock enough. (Source: Koyfin)
BMO Capital had a recent Outperform initiation last week and a $455 price target citing Broadcom’s AI business grew 65% in FY26 and the firm expects growth of 180% in FY26, suggesting sustainable growth and solid profitability. The firm added that the XPU business is accelerating, and that networking remains a key pillar. RBC Capital adds that Broadcom’s long-term contract and expanding TPUs adoption beyond Google should support continued growth for the next few years. (Source: Fly on the Wall)
Why AVGO Matters for the Entire AI trade
Broadcom is now approximately 2.65% of the S&P 500, making it the sixth-largest individual holding in SPY as of August 27. So an 8–12% AVGO move isn’t isolated—it can visibly affect SPX, QQQ and semiconductor ETFs.
More importantly, its commentary gives us a read on the breadth of AI capex.
Nvidia just delivered another extremely bullish demand signal, forecasting roughly 70% revenue growth next fiscal year and describing enormous hyperscaler spending/backlogs.
If Broadcom independently says custom AI silicon and networking demand is accelerating, that’s powerful confirmation that the AI infrastructure cycle remains broad rather than simply Nvidia-specific.
A bullish AVGO report would point to key beneficiaries. The clearest positive read-through would be:
- MRVL: custom ASIC validation.
- ANET: AI networking demand.
- NVDA: positive for total AI compute spending, although there’s an important caveat.
- TSM: more leading-edge custom AI silicon ultimately means more foundry demand.
AVGO Options Market
This is where the setup gets particularly interesting for options traders. The recent 30 day ATM implied volatility is roughly 75%.
AVGO’s Sept. 4 weekly options currently imply roughly an 8.1% earnings move. Around a $370 stock, that translates approximately to:
- Upside bound: ~$400
- Downside bound: ~$340
Interesting wrinkle: upside weekly calls are carrying particularly high IV. The Sept. 4 $390 call is around 88.5% IV compared with about 80.6% IV on the $350 put.
That makes us favor call spreads over outright calls for bullish trades.
We can see below in the Spotgamma Volatility Skew chart that September options are pricing a higher call skew to the upside, with current IV (gray line) well above the normal range from the past 90 days (shaded area) for contracts above the 350 strike.
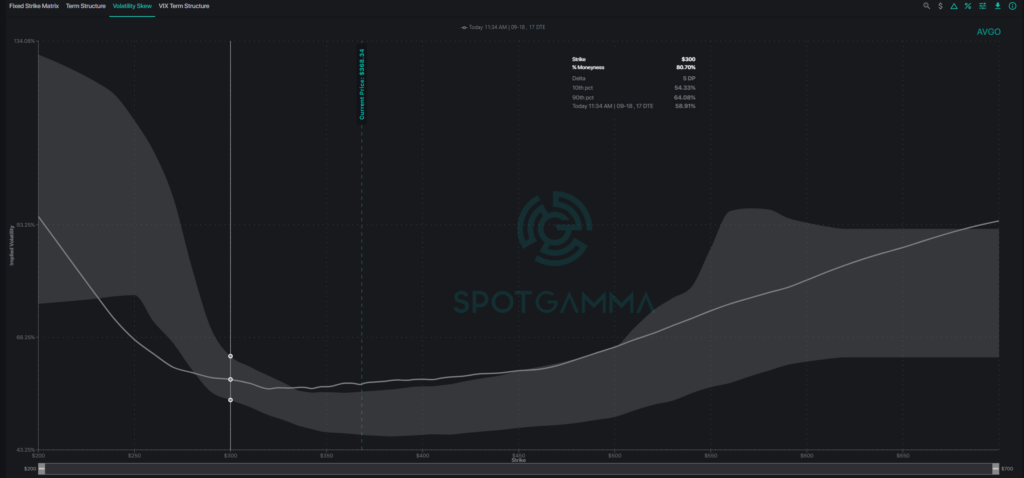
SpotGamma AVGO volatility skew chart showing current IV skewed to the call side.
In other words, options traders are pricing in more risk to the upside than downside. This is not to say that the stock will rise after earnings, but if it does see an outlier move (beyond its 8% expected move) then a move higher would be the most likely outlier event.
This information gives us a good clue that using option spreads such as verticals or calendars can be much more attractive than usual if playing the move into earnings.
AVGO: Prior 8 Earnings Implied vs. Actual Moves
For consistency, the below table compare the next-session close-to-close stock reaction, rather than after-hours peaks, in this quick table of earnings reactions.
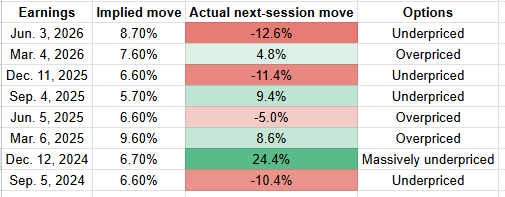
The implied move for AVGO earnings the prior 8 quarters and the resulting realized actual move.
Using that series of data from the past 8 reports going back 2 years:
- Average implied move: ~7.3%
- Average absolute realized move: ~10.8%
- Median absolute realized move: ~9.9%
- AVGO exceeded the priced move: 5 of 8
And that’s the most interesting statistic in this setup. AVGO tends to surpass the priced in move and by a decent margin with the median realized move after reporting being 10%.
What Does Dealer Gamma Say?
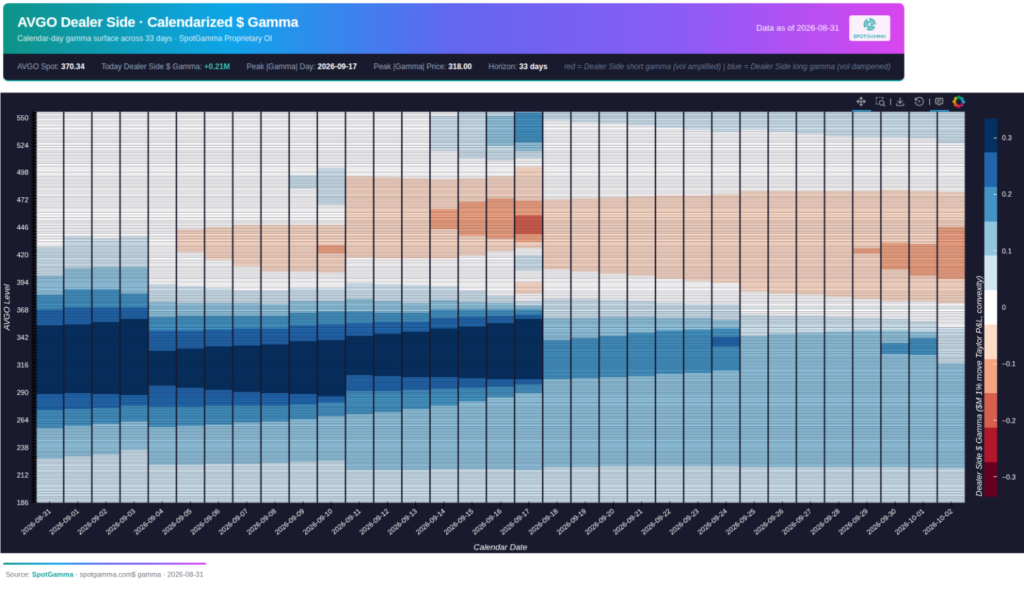
SpotGamma Calendarized Gamma Map showing September expiration options with positive gamma surface below current prices (dark blue).
Dealers appear to be heavily tilted to positive gamma exposure below current prices for all expirations into September monthly OPEX on 9/18. The blue shaded map above shows a good bulk of that concentrated on 9/4 expiration from 350 down into 300. This creates potential support from a positive gamma regime for AVGO.
Essentially, the gamma heatmap above tells us that a selloff after the report may see dealers buy into the dip, potentially resulting in a bounce. On the upside there is less of a clear read, although September options show some light red shaded gamma above 410 which the Synthetic Open Interest model below also illustrates.
SpotGamma’s Synthetic OI model below shows a positive sloping gamma line down into 340 where the lower bound of the expected move lines up. Potential supportive dealer positioning exists in that 320-350 range overall. On the upside we see gamma positive still but flattening out above 400. The 410 strike shows a larger negative gamma bar which may be a target higher if the expected move is surpassed beyond the 400 round number.
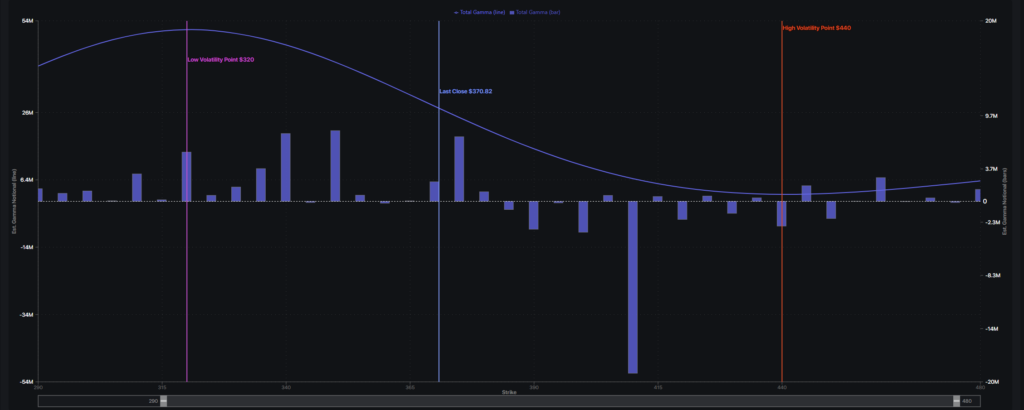
SpotGamma Synthetic Open Interest gamma model for AVGO, showing positive gamma below current levels.
Setup to Watch: Diagonal Spreads for Upside
Similar to NVDA last week, AVGO has a clear volatility term structure edge as front week options are seeing IV pricing much higher than October volatility.
Calendar spreads typically provide a positive risk/reward approach into earnings, and coupled with this type of higher IV, can provide an attractive profile.
One other wildcard we didn’t mention was that Anthropic is expected to have its IPO before October ends as the next big AI stock to go public. That sets up the chance to get long October premium in a name like AVGO while selling September premium. We can do so through a more directional stance using a diagonal spread. The idea being that while AVGO has also pulled back considerably from its summertime peak compared to NVDA, the odds of a rebound may be higher.
Short September 18th premium / Long October 16th premium
A trader expecting a bullish reaction toward $400+ could look at a long $400 October call and short the Sept 16th $410 call. This creates a diagonal spread at a net debit of $7.85. That is the max risk on the trade which could profit in a wide range but optimally into the short strike of $410.
The diagonal spread offers a higher delta exposure than a normal calendar spread since the strikes are slightly different.
Bonus idea: Another trade setup that looks intriguing is playing the post-earnings reaction. If AVGO sank lower, it would offer a chance to sell bull put credit spreads into that positive gamma support noted between 330-350, expecting that area to provide a floor.