• Skip to main content
  • Skip to primary sidebar

SpotGamma™

S&P 500 Stock Market Gamma Trading Levels Based on Options Open Interest

  • About
  • Pricing
  • Academy
  • Resources
    • Tool Demos
    • Case Studies
    • Blog
    • Support Center
    • Daily Report
    • Free Trading Tools
      • Opening Setup Free Report
      • Options Profit Calculator
      • SPX Gamma Exposure
      • Implied Earnings Moves
    • Free Training
    • Report Card
  • Login

call skew

Sep 22 2026

NDX Call Skew Has Room While S&P Vol Contracts: Kochuba on tastylive

Brent Kochuba of SpotGamma joined tastylive September 22 on vol expansion, NDX call skew and the dispersion rebuilding across tech.

Written by SpotGamma · Categorized: Market Analysis · Tagged: 0DTE, call skew, dispersion, MU, NDX, realized volatility, SPX, SPY, tastylive

Sep 07 2026

AI Infrastructure Runs Hot into September
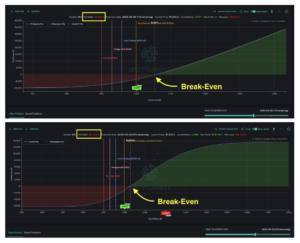
Two profit/loss charts for MU stock showing break-even points around $1,000 strike with expiration on 2026-09-29.

August closed with robust corporate earnings, and nowhere was that clearer than in the AI trade stocks. Last week’s standout report came from Dell (DELL), which jumped 16% after beating estimates and raising guidance. Dell is a leading server provider for AI data center infrastructure. Its results echoed what Nvidia (NVDA) showed a week earlier: […]

Written by Sherry An · Categorized: Market Analysis, SpotGamma Weekly · Tagged: AI data center stocks, bull call spread, call skew, dealer gamma, DELL earnings, Gamma Exposure, implied volatility, Options Calculator, options positioning, options skew, semiconductor rotation, spotgamma weekly, theta decay

Sep 03 2026

AI Stock Options Reset From a Record Peak: Brent Kochuba on tastylive

AI Stock Options Reset From a Record Peak: Brent Kochuba on tastylive

Brent Kochuba on tastylive: AI stock options have reset from record dispersion, and the positioning no longer rewards shorting tech.

Written by SpotGamma · Categorized: Market Analysis · Tagged: AI stocks, Brent Kochuba, call skew, crude oil, dispersion, implied volatility, semiconductors, tastylive, TSLA

Sep 02 2026

Broadcom is the Next AI Focused Catalyst
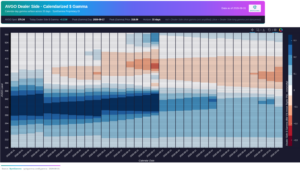
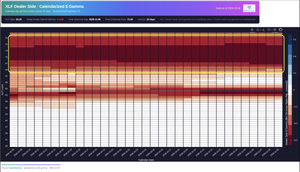
AVGO dealer side gamma heatmap showing price levels and calendar dates with peak gamma at $318 on 2026-09-17.

Fundamentals Broadcom (AVGO) is the most important remaining AI hardware earnings report of the week, providing investors with a different read on AI spending compared to Nvidia. Nvidia tells us about demand for general-purpose GPUs, while Broadcom tells us about custom AI accelerators, networking, hyperscaler silicon programs, and the increasingly competitive threat to Nvidia from […]

Written by SpotGamma · Categorized: Market Analysis · Tagged: AVGO, call skew, dealer gamma, diagonal spread, earnings, gamma, volatility

Jul 05 2026

Passing the Baton: From Semis to Software?
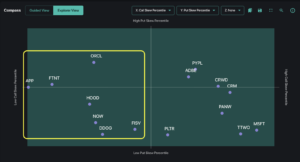
Scatter plot showing call and put skew percentiles for various stock tickers, with a highlighted cluster on the left side.

The AI trade has been the story of the first half of 2026, and semiconductors have been the main characters. The sector now accounts for roughly 20% of the entire S&P 500 — a historically high concentration. As we covered in our previous newsletter, any meaningful profit-taking in this area brings up the important question […]

Written by Sherry An · Categorized: Market Analysis, SpotGamma Weekly · Tagged: call skew, call spread strategy, earnings volatility, implied volatility, IV Rank, market makers, market volatility, options positioning, options trading, sector rotation, ServiceNow options, software stocks, SpotGamma Compass, spotgamma weekly, Volatility Skew

May 31 2026

June Catalysts Threaten a Volatility Spasm — How Are Traders Positioning?
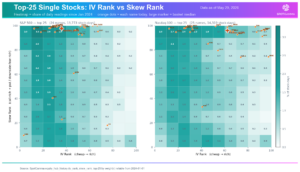
Heatmap comparing IV rank versus skew rank for top 25 S&P 500 and Nasdaq-100 stocks as of May 29, 2026.

The S&P 500 has posted fresh record highs for the ninth straight week. Tech and semiconductor earnings fueled much of the recent surge, with SNOW climbing 52%, DELL gaining 57%, and MU surging 28% within one week. As we move into June, stretched positioning now meets a cluster of major catalysts. Three upcoming events will […]

Written by Sherry An · Categorized: Market Analysis, SpotGamma Weekly · Tagged: call skew, COR1M, dealer gamma, dealer hedging, dispersion risk, Gamma Exposure, implied volatility, June OPEX, market makers, positive gamma, put diagonal, spotgamma weekly, SPX options positioning, SPX term structure, volatility spasm

May 25 2026

Record Highs and Thinning Hedges

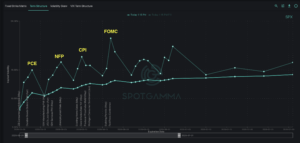
SPX implied volatility term structure chart showing economic events from May to July 2026, with peaks at PCE, NFP, CPI, and FOMC dates.

Last week, the S&P 500 closed its eighth straight weekly gain — the longest streak since 2023. As the rally continues to achieve record highs, underlying options positioning has evolved meaningfully since March. Most importantly, the market has quietly shed much of the protective hedging that was in place just two months ago. A dense […]

Written by Sherry An · Categorized: Market Analysis, SpotGamma Weekly · Tagged: call options, call skew, dealer gamma, dealer hedging, Gamma Exposure, implied volatility, market makers, risk reversal, spotgamma weekly, SPX options positioning, SPX term structure

Mar 01 2026

The Options Market Trapdoor

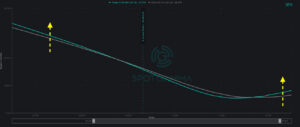
SPX options chart showing implied volatility curve with strike prices, highlighting two price levels marked by yellow dashed lines and arrows.

Over the past week, the topic of volatility has returned to the forefront. While the market has been largely range-bound, underlying support remains tenuous. Simultaneously, traders have begun more actively paying for downside protection. Given the backdrop of flaring geopolitical conflict, we see assymetric downside risk forming as trader uncertainty and negative gamma threaten to unlock the […]

Written by Simon Scholten · Categorized: Market Analysis, SpotGamma Weekly · Tagged: call skew, Compass, dealer gamma, dealer positioning, iv, negative gamma, positive gamma, put skew, spotgamma weekly, SPX, Synthetic OI, volatility, Volatility Skew

Primary Sidebar

SpotGamma-Subscriber-Signup-Banner

  • Erasca’s November Catalyst: Promising Data, High Expectations and Strategic Optionality
  • NDX Call Skew Has Room While S&P Vol Contracts: Kochuba on tastylive
  • Costco Earnings: What Shoppers—and Options—Are Telling Us
  • The S&P500’s Diversification Problem
  • Quiet Oil Options Mask Tail Risk
  • youtube
  • x
  • Privacy Policy
  • Disclaimer
  • Terms & Conditions
  • Support Center
  • Media
  • Contact Us

©2026 TenTen Capital LLC DBA SpotGamma

All SpotGamma materials, information, and presentations are for educational purposes only and should not be considered specific investment advice nor recommendations. Futures, foreign currency and options trading contains substantial risk and is not for every investor. An investor could potentially lose all or more than the initial investment. Risk capital is money that can be lost without jeopardizing one's financial security or lifestyle. Only risk capital should be used for trading and only those with sufficient risk capital should consider trading. Past performance is not necessarily indicative of future results. Testimonials appearing on this website may not be representative of other clients or customers and is not a guarantee of future performance or success.

View Full Risk Disclosure