Meta’s new Muse AI Agent has done what a year of capex headlines could not: it has convinced the market that the company’s $200 billion investment in AI has a consumer-facing payoff. META rallied 13% over the past week and pushed toward 52-week highs as the personal agent app topped the download charts.
The enthusiasm spilled well beyond META. The idea that agentic AI needs persistent compute reignited the data center trade, led by INTC, AMD, and ARM. Meanwhile, Goldman’s “consumer inertia” stocks, from banks and brokers to insurers and SaaS, sold off on fears AI agents could erode customer stickiness.
For META specifically, the stock has already bounced back nearly 40% from its July lows, yet options positioning suggests the move may not be over yet. In today’s newsletter we examine where dealer gamma sits for Meta, how the volatility profile has shifted, and what trade structures might fit the current setup.
Negative Gamma to the Upside Could Fuel Further Gains
As of Friday, SpotGamma’s Synthetic OI Model shows positive dealer gamma below the current price and negative gamma above price for the next three weeks. Positive gamma means that dealers hedge by buying dips and selling rallies, which dampens price movement. Negative gamma flips that dynamic, where dealers buy into rallies and sell into weakness, which can amplify moves.
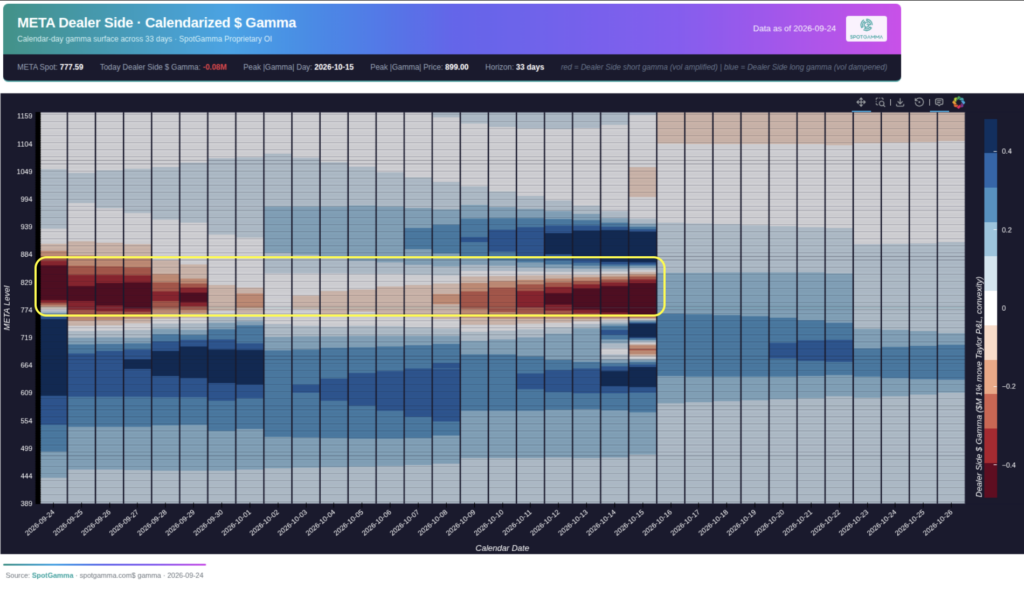
By strike, the positive-gamma zone around 700–750 stands out as a potential stabilizing area. Above the spot, negative gamma from roughly 770 to 880 marks a region where hedging flows could add to price movement if the stock keeps climbing. A pullback toward 700–750 could also let option premiums reset without disrupting the broader setup.
We saw eerily similar setups in MSFT, NOW, and INTC over the summer. Each of these stocks then rallied meaningfully in the weeks that followed. While each stock experienced different tailwinds, the parallel options structure is worth noting.
y remains subdued.
Implied Volatility & Skew: More Room to Run
Comparing META’s volatility skew with July, the curve has steepened. At-the-money implied volatility (IV) has compressed while IV in both wings has moved higher. In plain terms, options far from the current price have become more expensive relative to options near it.
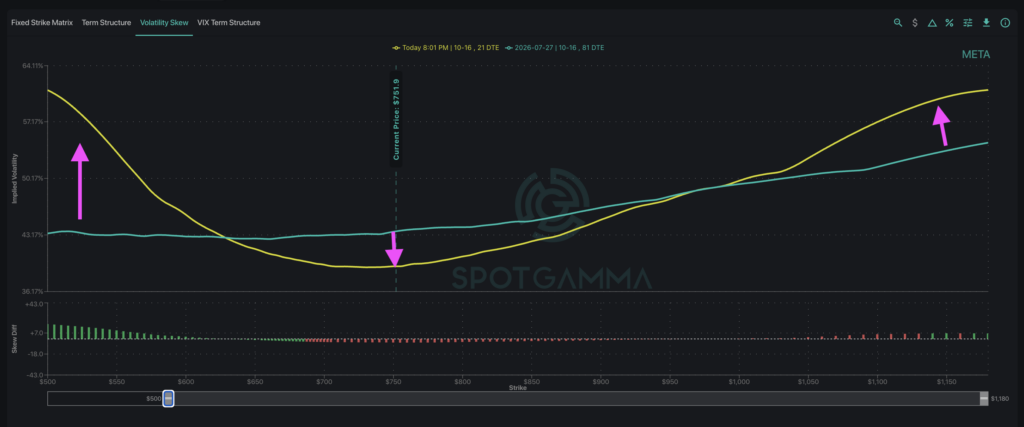
META’s IV Rank is 62%, placing current implied volatility in the upper half of its one-year range. Realized volatility indicates how much the stock has actually moved, which has roughly doubled: META’s daily range has been $20–35 for the past week, compared to a $10–15 range two months ago.
Call skew sits at the 65th percentile, meaning upside calls are pricier relative to puts than in about two-thirds of the past year. The data suggests traders are still paying for upside rather than fading the move. This also means outright long calls are expensive here, which points to spreads as a potential way to play a continued rally.
One Trader’s $22m Call Spread Fits The Setup
One noteworthy trade from Friday’s Opening Setup report plays the upside in a way that capitalizes on elevated implied volatility. In this case, the buyer paid roughly $22M for 18K lots of the October 825/900 call spread. Keep in mind that the 825 strike sits solidly within the negative-gamma zone ~10% above spot.

With volatility elevated after META’s rally, outright long calls appear quite expensive. A call spread adds a further out-of-the-money short leg, which can reduce premium outlay while keeping risk defined.
The structure – long the 825 call at ~20 delta and short the 900 call at ~5 delta – targets the negative-gamma region while using the short call to help finance the position.
Using SpotGamma’s Options Calculator, we can adjust the IV and call-skew assumptions to reflect different trader views. The dashed yellow line indicates the PnL based on current market IVs, while the blue line – and red-green coloration – indicates the adjusted PnL.
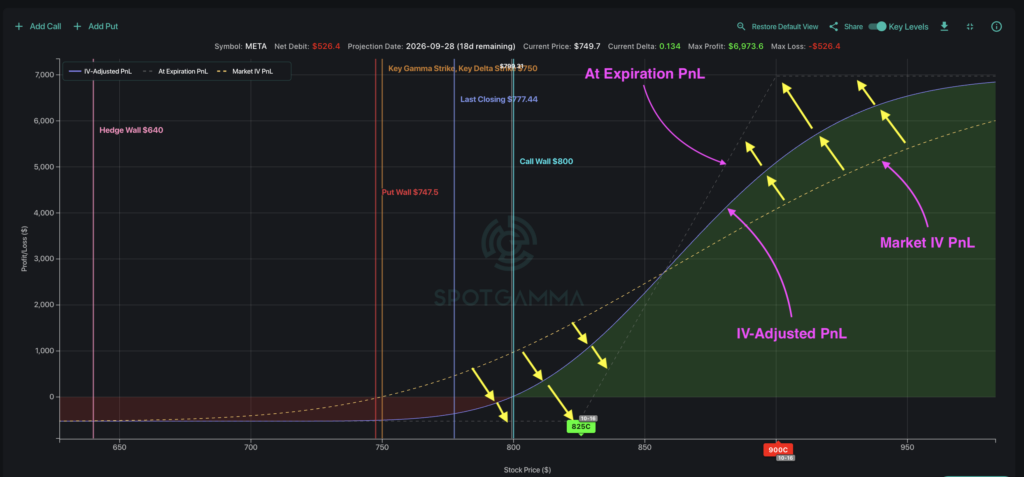
Should IV mean-revert downwards while call skew remains elevated, the position still retains value above 800 while PnL grows more positive above 860. In a scenario where price does not rally, the loss is capped at ~$500 per contract — while upside remains significant in case negative gamma does indeed fuel a rally upwards.
When analyzing trade setups, modeling changes in price, time, and implied volatility reveals how each factor impacts the PnL. Combining dealer gamma with an understanding of volatility and options pricing helps traders both lean into their edge — and capitalize effectively when they uncover trade opportunities.