Meta Platforms (META) reports Wednesday with investors weighing AI monetization against an increasingly expensive infrastructure buildout. For options traders, the question is different: Is the market charging enough premium for another outsized earnings gap?
1. What the Options Market Is Pricing
With META near $690 in the pricing snapshot, the earnings-specific implied move is approximately ±5.5%, translating to an indicative $652-$728 range. The October 23 at-the-money straddle prices a larger ±6.9% move, since it includes additional trading time through Friday.
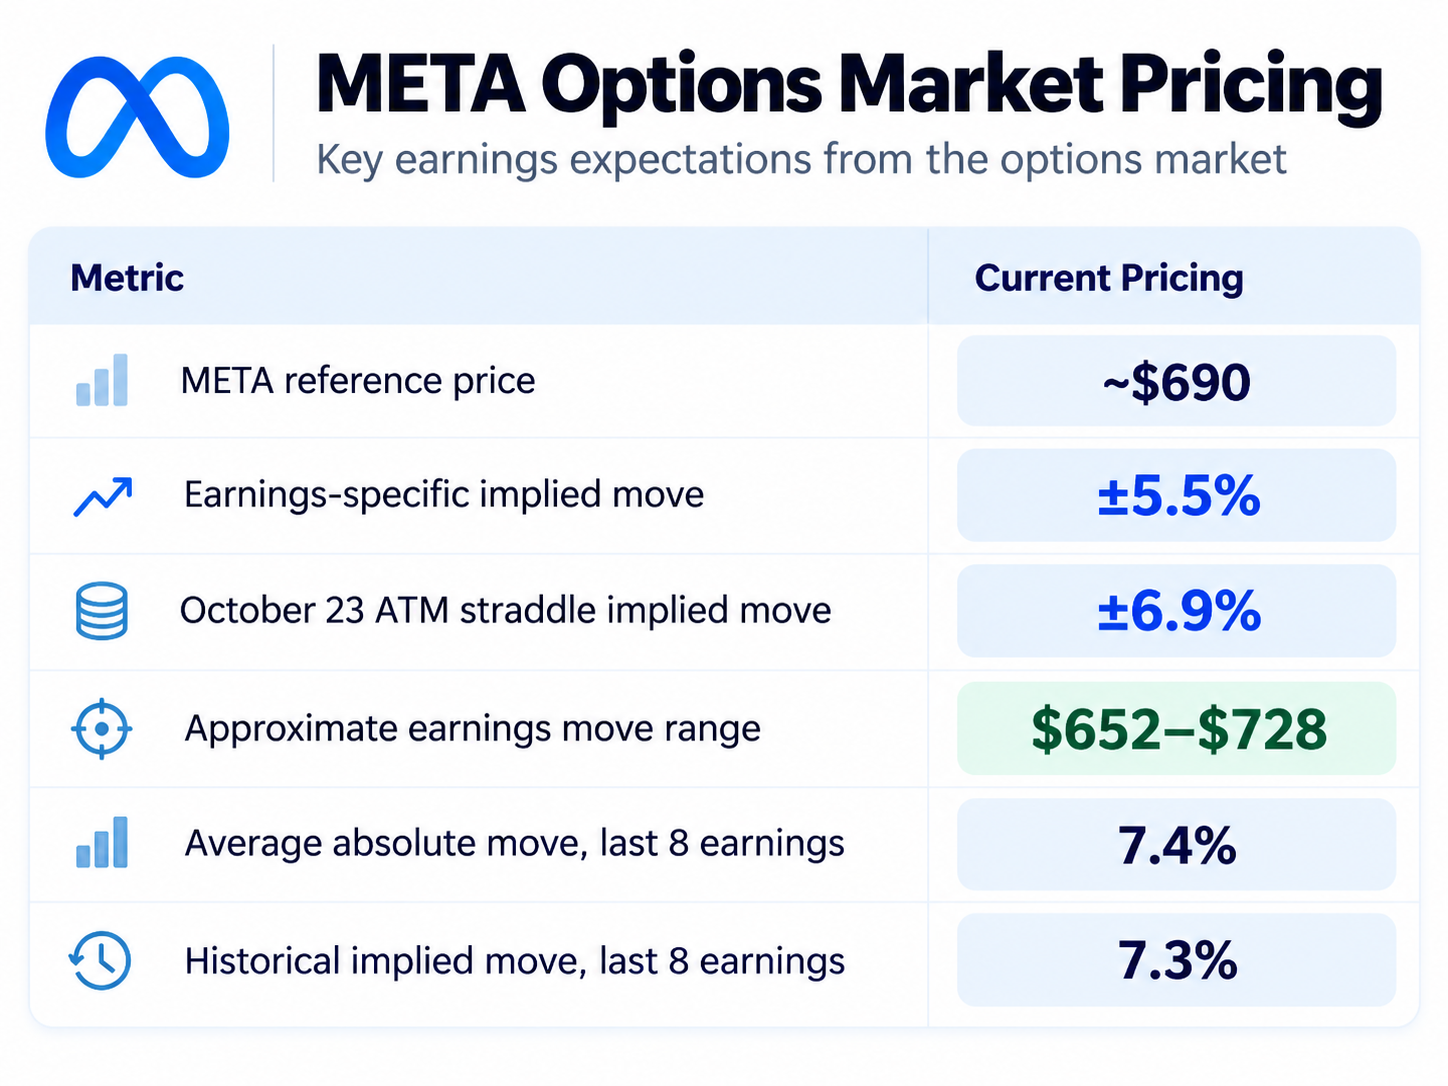
That distinction matters. The earnings-specific estimate isolates the event premium, while the weekly straddle includes additional time value. For historical comparison, the 6.9% straddle estimate is closer to the measure used in the eight-quarter study, which averaged 7.3%.
2. Dealer Gamma Positioning: Key Levels to Watch
META’s SpotGamma synthetic open-interest chart shows a pronounced positive gamma concentration at $750, with the modeled Low Volatility Point at $742.50. Significant negative gamma concentrations appear near $700 and $800.
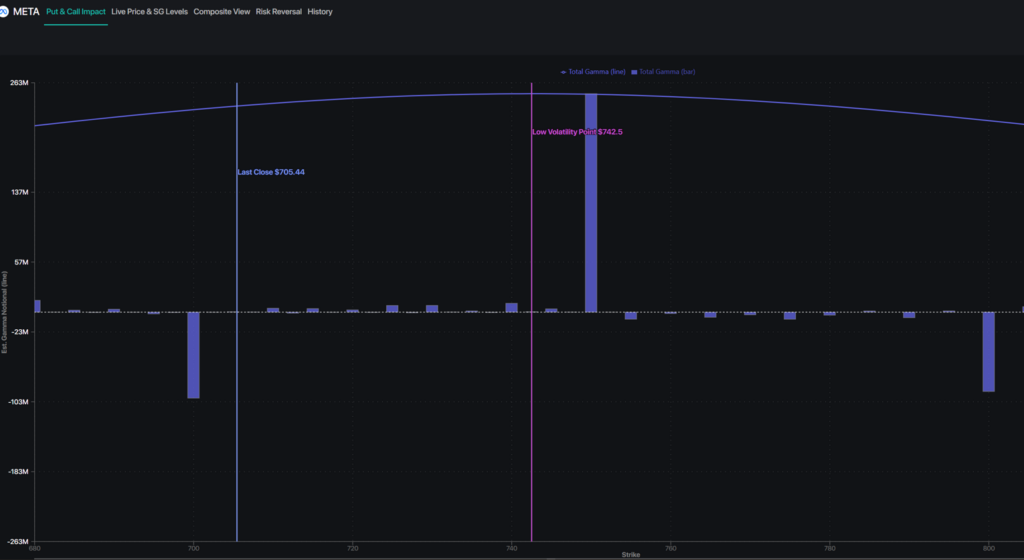
Near $700, negative local gamma could increase sensitivity to directional hedging flows. Conversely, an upside earnings reaction toward $742.50-$750 would approach an area where positive gamma may encourage more stabilizing dealer activity. The $680 put wall is a downside level to monitor on a selloff.
The accompanying volatility skew adds another dimension. Implied volatility rises sharply at deep downside strikes, indicating relatively expensive bearish tail protection. Upside calls also carry elevated IV, although the downside wing is noticeably steeper.
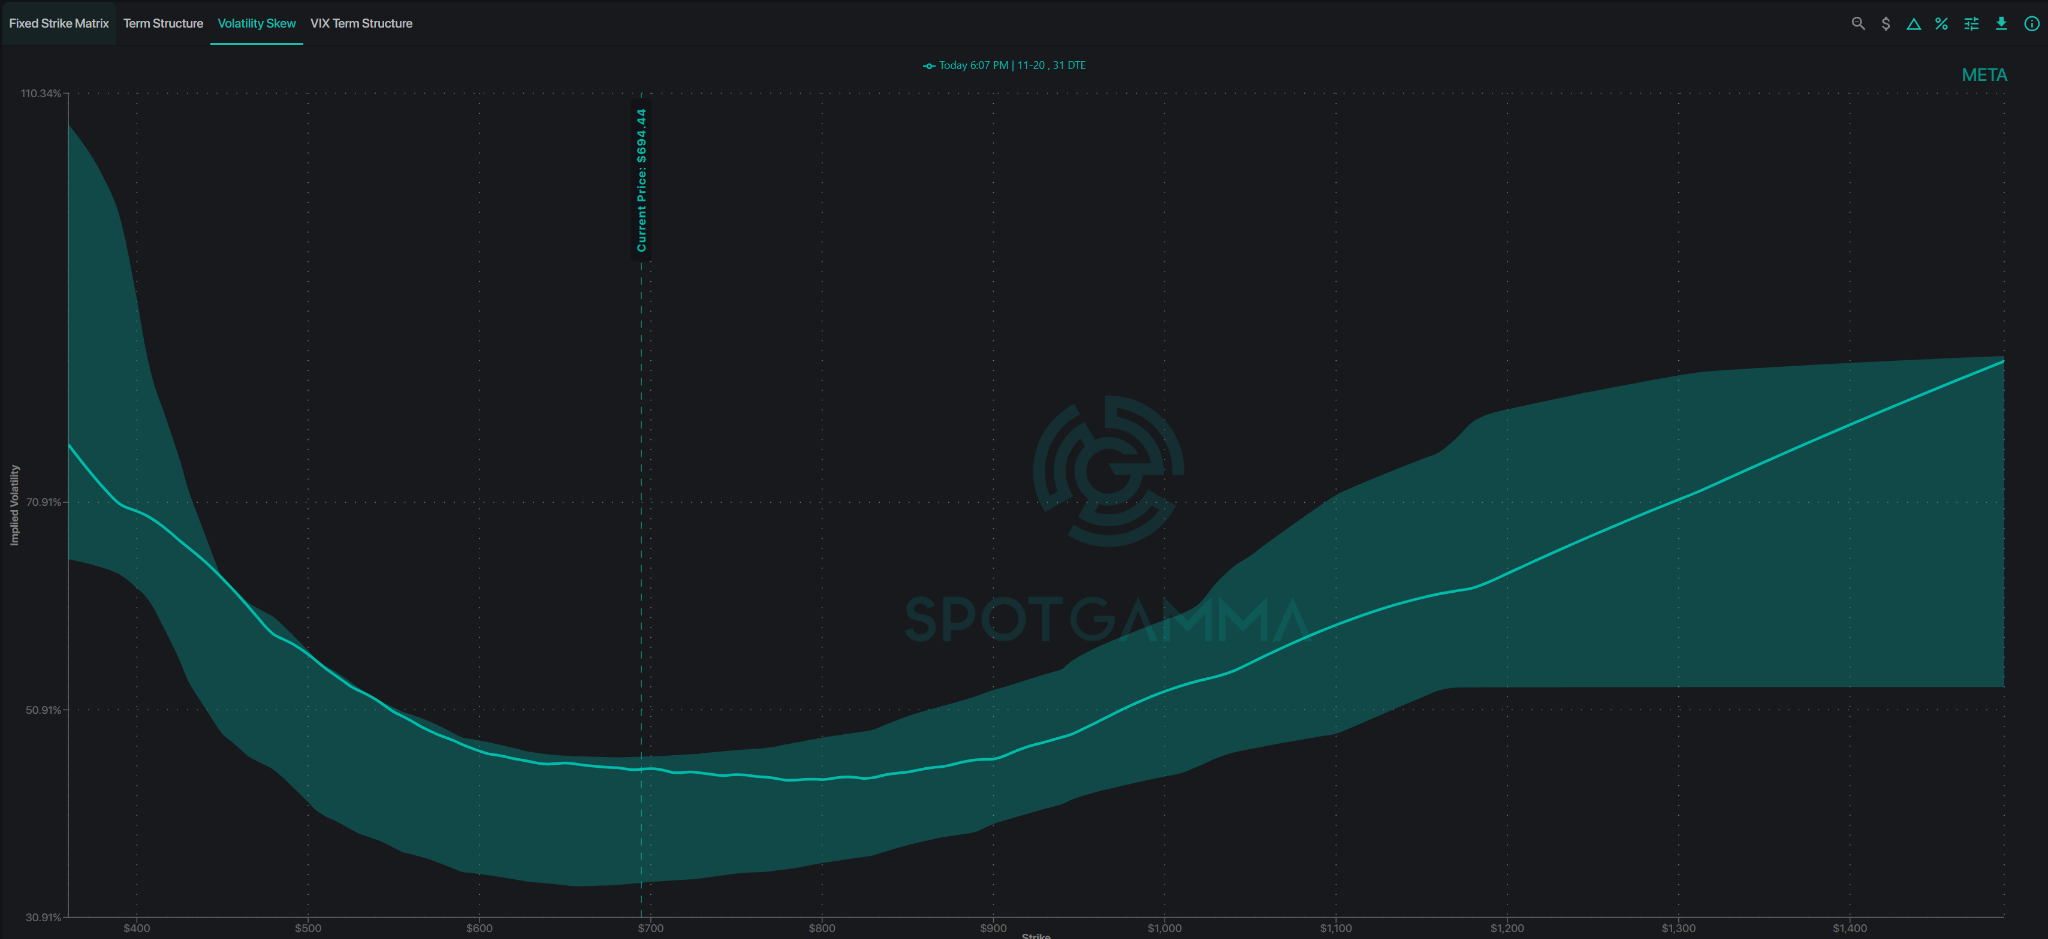
This suggests an asymmetric pricing structure favoring downside protection, although one snapshot cannot establish whether put demand is actively increasing.
Key takeaway: Gamma positioning may influence trading ahead of earnings, but a substantial overnight gap and subsequent volatility collapse can quickly reshape these exposures.
3. Historical Earnings: Has META Been Moving More Than Expected?
Over the last eight earnings reports, META’s average absolute next-session closing move was approximately 7.4%, compared with an average pre-earnings straddle-implied move of 7.3%.
Actual moves exceeded the quoted implied move in four of those eight quarters.
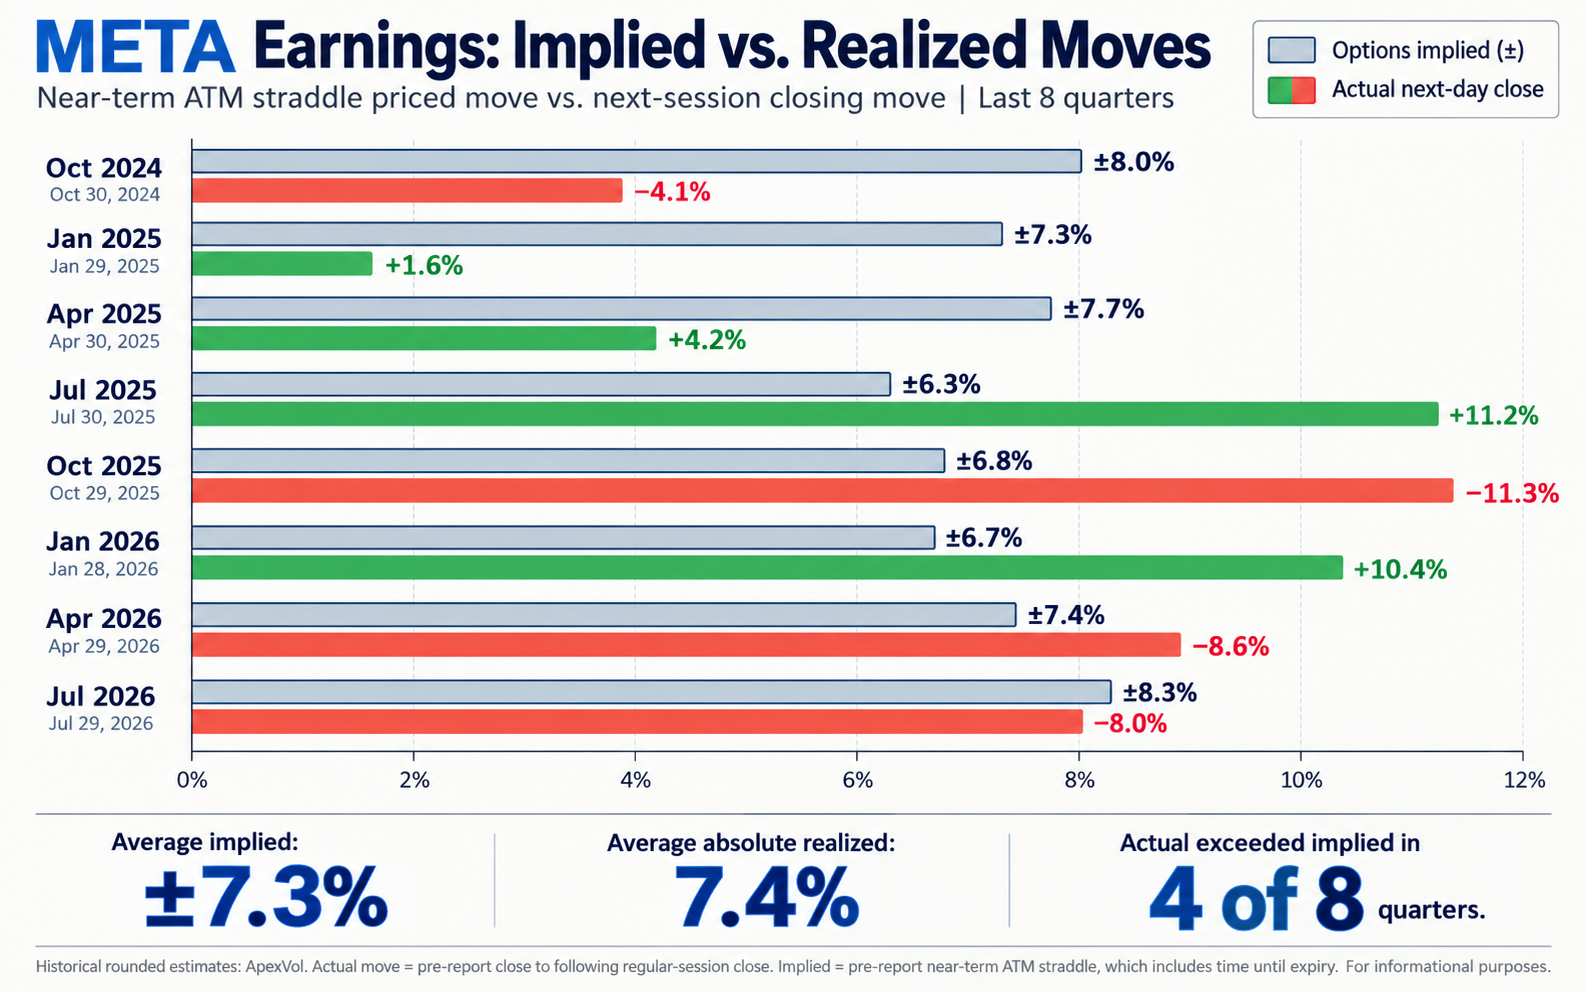
More notably, the latest four reports produced absolute closing moves of approximately 8.0%, 8.6%, 10.4%, and 11.3%, with three exceeding their respective implied moves.
That recent history underscores the possibility of another substantial earnings gap. However, it does not establish a persistent edge in buying volatility.
Long-premium traders still require sufficient movement to overcome the premium paid and the post-earnings decline in implied volatility. Meanwhile, short-premium traders face the risk that another outsized gap exceeds the credit collected.
4. What Wall Street Needs to See
Consensus expectations call for approximately $63.3 billion in revenue and earnings around $6.60 per share.
Beyond headline results, three factors should drive the reaction:
- Advertising momentum: Continued monetization and revenue growth across META’s core platforms.
- AI monetization: Evidence that its Muse ecosystem and AI investments are translating into sustainable commercial opportunities.
- Capital expenditures: Whether accelerating infrastructure spending threatens future margins, cash flow, or profitability.
Strong revenue alone may not be enough if management signals significantly higher investment requirements.
5. Post-Earnings Reaction Scenarios
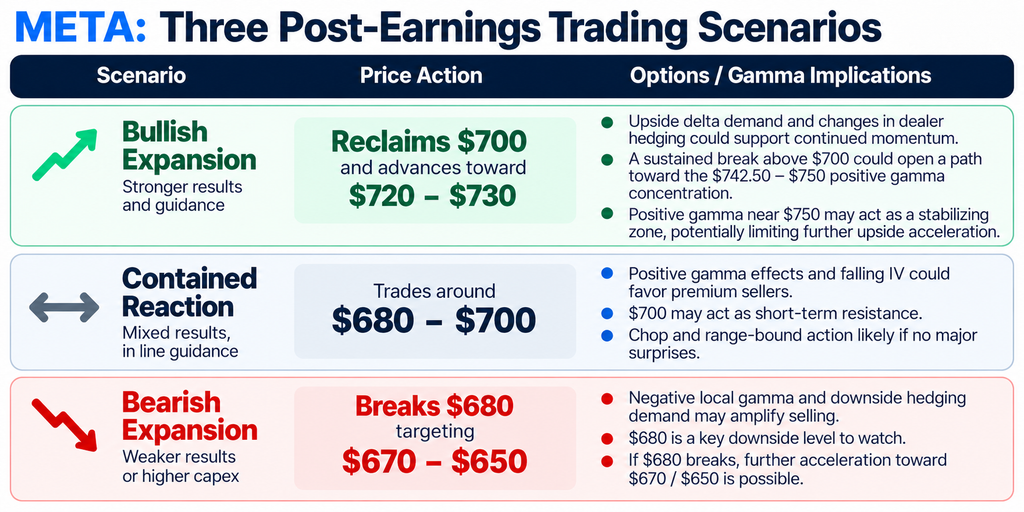
Thursday’s opening hour should offer valuable clues about whether the overnight earnings gap is being accepted or faded.
6. Defined-Risk Earnings Trade Ideas
An interesting trade structure could be a bullish broken-wing call butterfly (BWB). Particularly if we’re targeting a rally into the $742.50-$750 positive gamma concentration.
Bullish opportunity: The October 23 $700/$745/$775 call broken wing butterfly (BWB), quoted at a $10.75 debit, targets a rally toward the positive gamma zone.
That is attractive because the fly’s peak profit occurs around $745, rather than requiring META to continue rallying well beyond $750.
This specific wing configuration is interesting because the lower wing is 45 points wide while the upper wing is only 30 points wide.
At a $10.75 debit, it would retain a $425 profit even if META finishes above $775. That is a very useful characteristic: you don’t have to fear a massive upside earnings surprise turning a winning bullish trade into a loss.
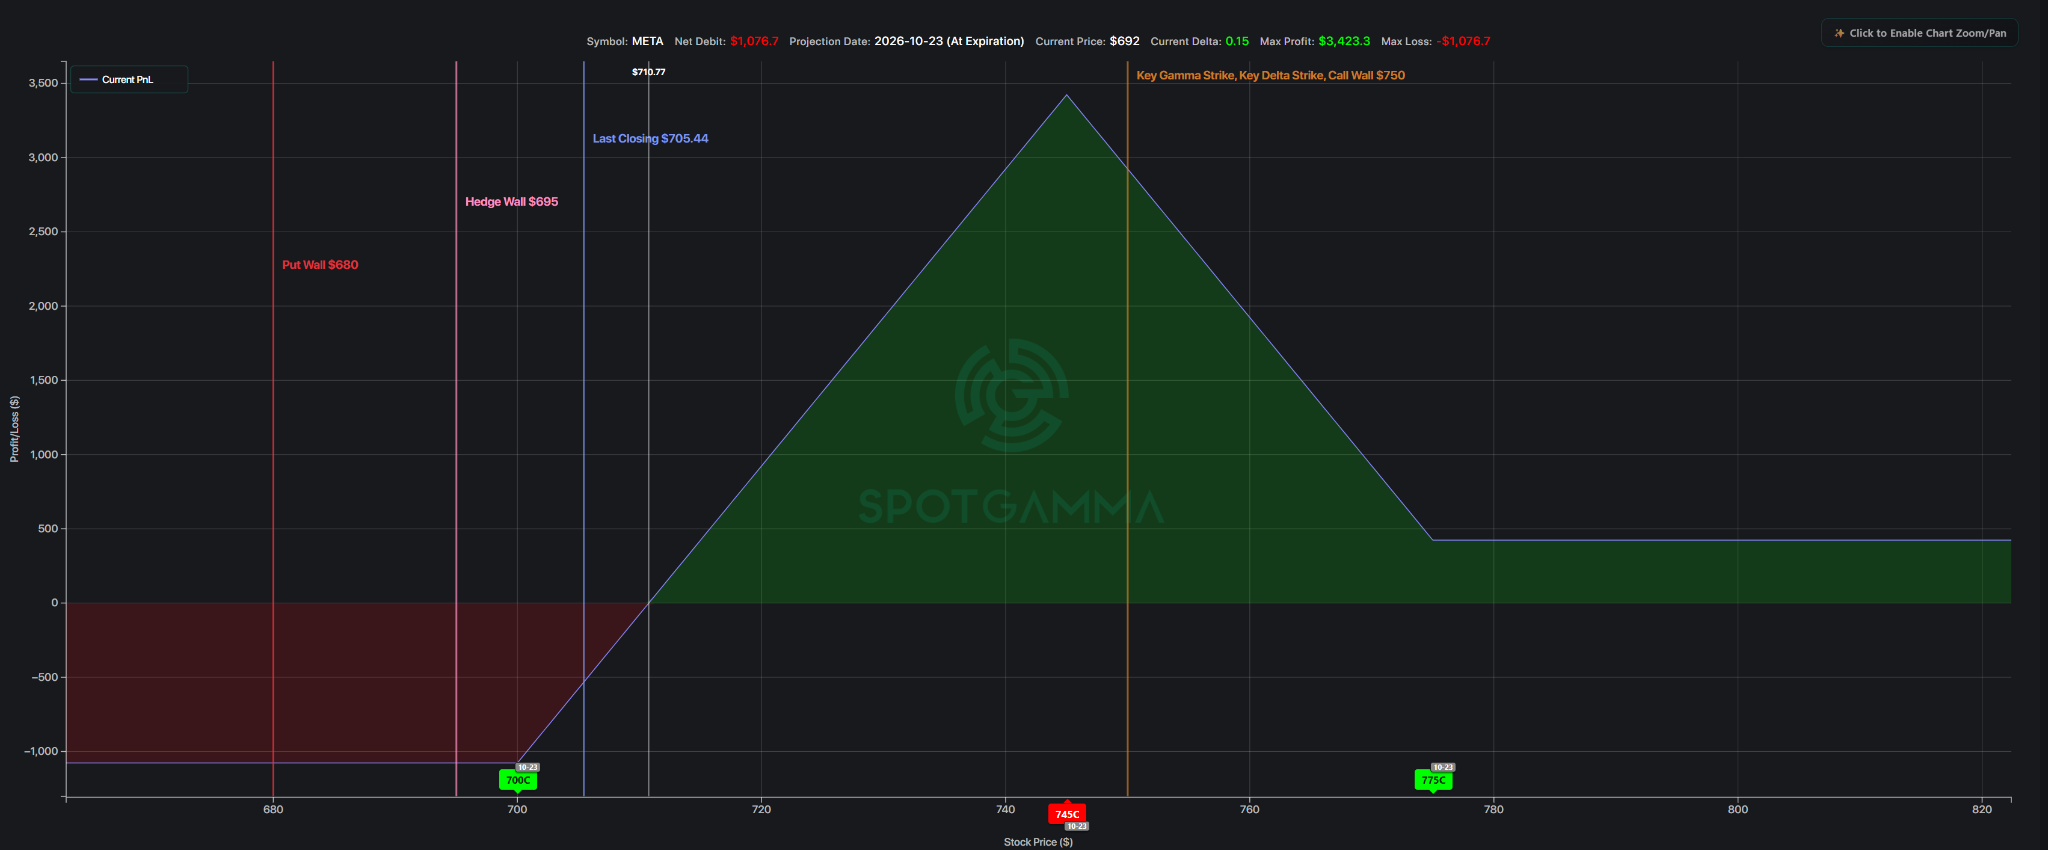
Given the elevated downside put skew, a preferred candidate is:
Put broken-wing butterfly opened for a credit: A more interesting alternative if you want to retain some downside convexity while collecting premium.
The October 23 $660/$650/$625 put broken wing butterfly (BWB), quoted at a $1.65 credit at Tuesday’s close, benefits from a flat-to-moderately-bearish reaction but risks substantial losses on a severe selloff.
You can collect a modest credit if META rallies or stays flat. A moderate selloff toward the $650 target zone can produce a larger gain, while the $625 long put defines the maximum loss. The downside breakeven for this credit-based, defined-risk alternative is $638.35. Below that level is where the risk lies and up to $1,335 of defined downside risk is possible if META were to have an outlier move lower.
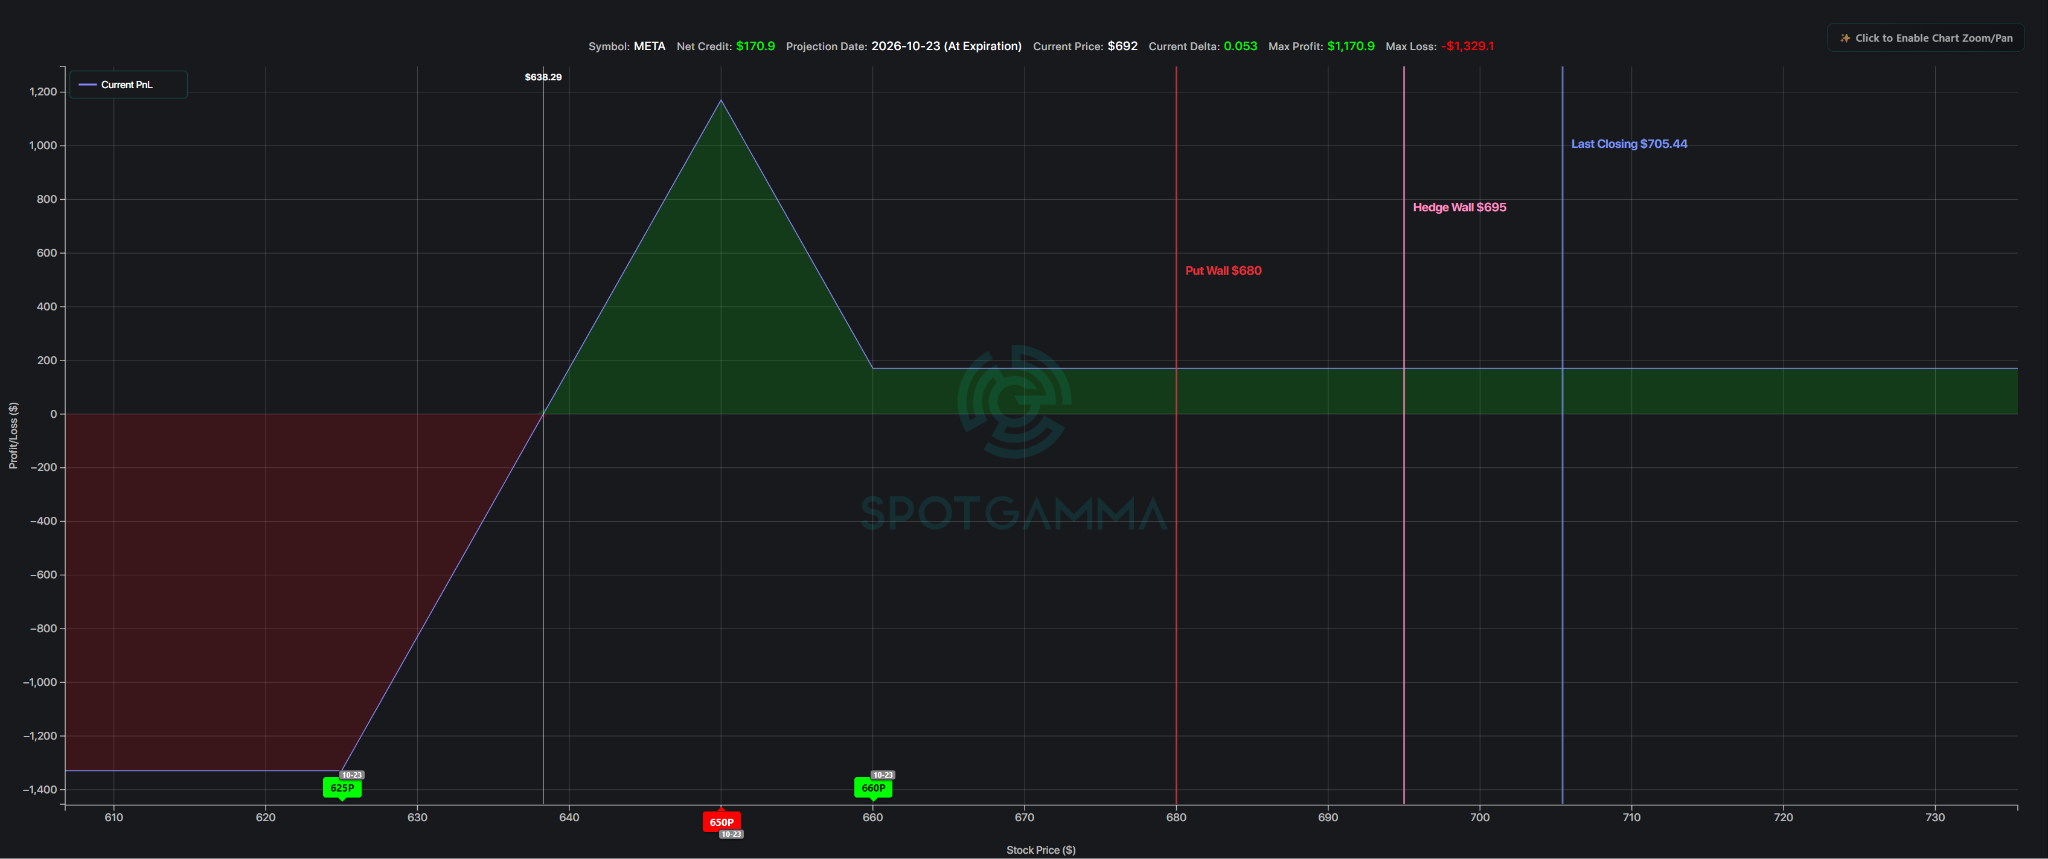
Both structures offer defined risk but carry meaningful exposure to the earnings gap. The payoff diagrams illustrate expiration outcomes, while actual profits and losses following Thursday’s earnings reaction will depend on stock price, remaining time value, and changes in implied volatility.
7. The Bottom Line
META’s recent earnings history suggests another large move is possible, while its gamma profile highlights distinct hedging environments around $700 and $750.
The opportunity may not be in predicting whether META beats earnings, but in correctly anticipating whether the realized move justifies the volatility premium already priced into options.
Data note: Options estimates and gamma positioning reflect October 20 snapshots and may change before earnings. Gamma exposure is modeled from open interest, not directly observed dealer inventory.