Intel enters earnings facing a critical test of its turnaround. Improving data center demand and foundry execution have revived investor confidence, but the stock’s recent rally raises expectations for another strong quarter.
INTC closed October 28 at $95.53, gaining 1.91% on the session and nearly 10% over the previous three trading days. The company reports October 29 post-close.
For options traders, the central question is whether Intel can deliver a reaction large enough to overcome the substantial volatility premium already priced into its options.
1. What Is the Options Market Pricing?
October 28 closing estimates place Intel’s October 30 at-the-money straddle near $8.90, implying approximately a 9.3% move in either direction.
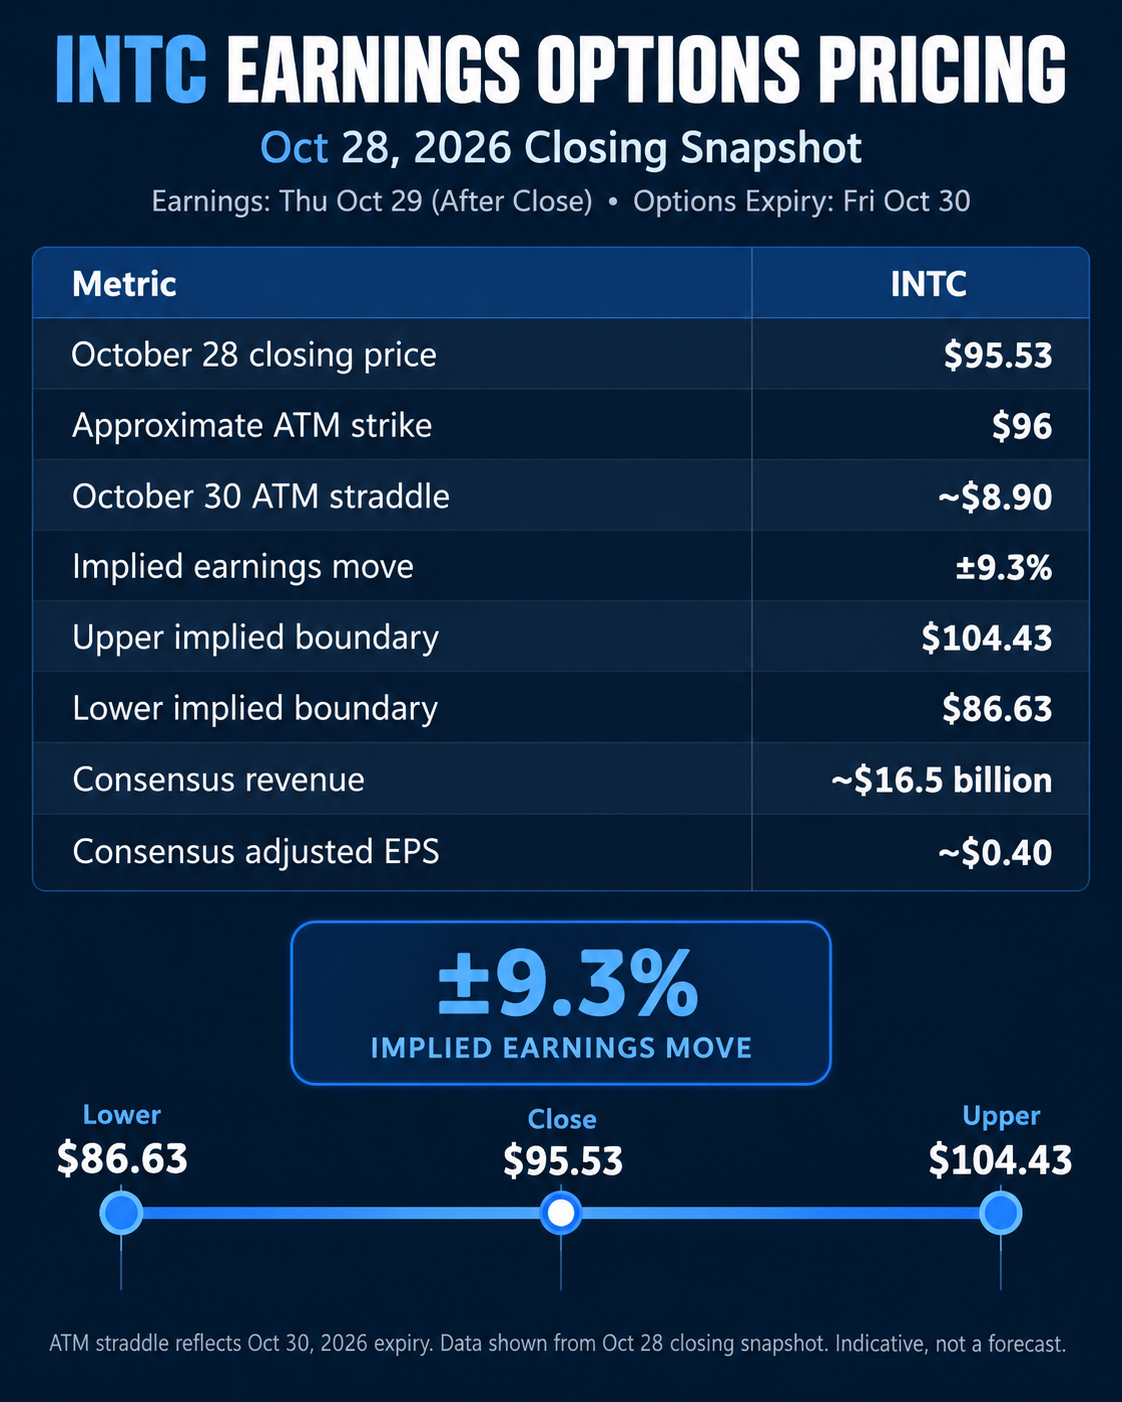
Intel has a history of sizable earnings reactions. Its previous four reports produced an average absolute next-session move of approximately 12.2%, including a 23.6% rally following April 2026 earnings and a 17% decline after January’s report.
The current implied move is below that recent four-quarter average, but the small sample and elevated option premiums make it difficult to conclude that volatility is necessarily cheap.
The takeaway: Intel has demonstrated substantial earnings volatility, but traders buying front-week options still need a meaningful price reaction to overcome the event premium.
2. Volatility Skew: Elevated Front-Week IV and Upside Call Demand
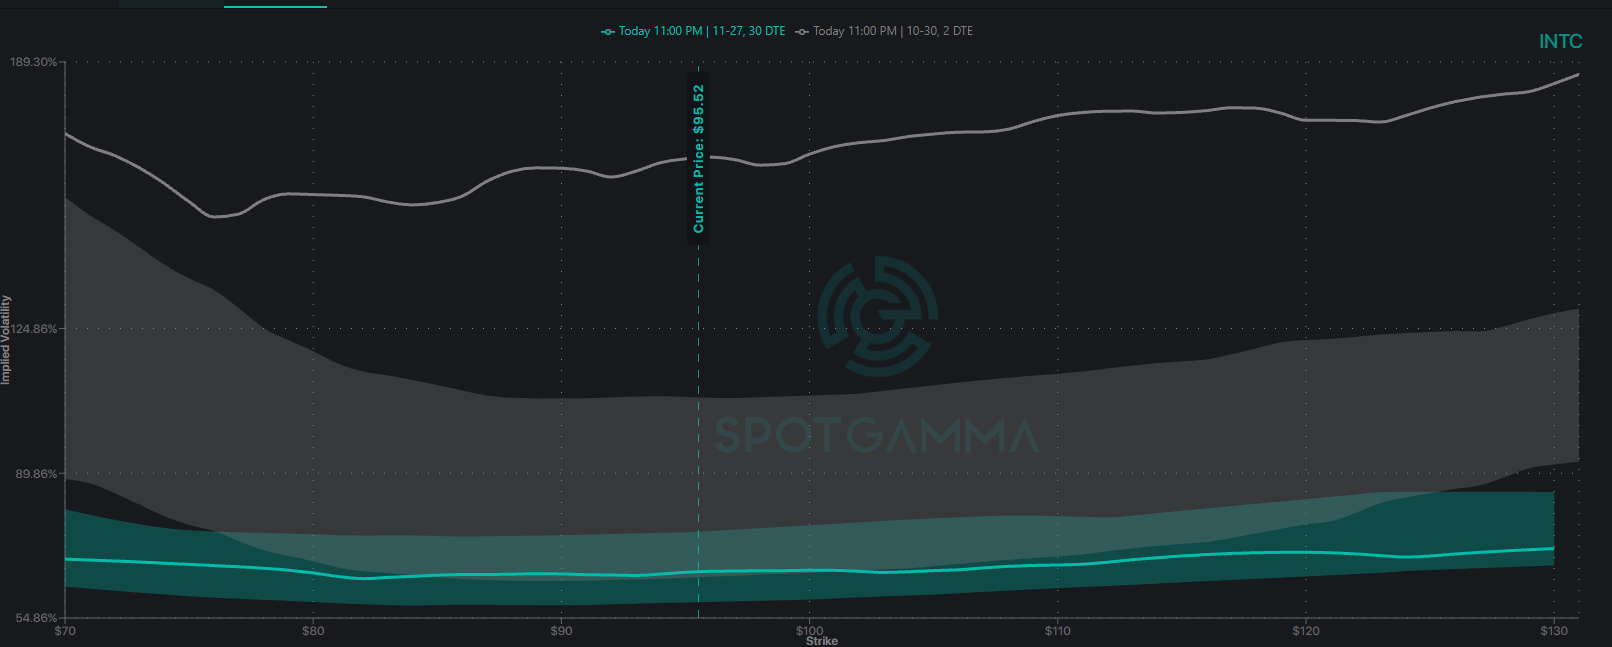
Intel’s updated SpotGamma volatility surface reveals a pronounced upside call skew in the October 30 expiration, with near-the-money implied volatility around 160–170% and rising above 180% at higher call strikes.
This contrasts sharply with the 30-day volatility curve, where implied volatility sits near 65–70% and remains considerably flatter across strikes.
The steep upward slope in front-week call volatility indicates unusually expensive upside exposure, suggesting traders are pricing meaningful upside tail risk without necessarily implying a bullish directional forecast.
For options traders, this creates an important trade-off. Elevated short-dated IV increases the cost of outright calls and the risk of post-earnings volatility crush. Defined-risk call debit spreads may offer more efficient bullish exposure by selling relatively expensive upside volatility.
The takeaway: INTC’s options market is pricing both substantial earnings uncertainty and a pronounced upside premium. A strong earnings surprise could produce accelerated upside movement—but traders buying calls are already paying heavily for that possibility.
3. Dealer Gamma: $100 Negative Gamma Could Amplify Upside
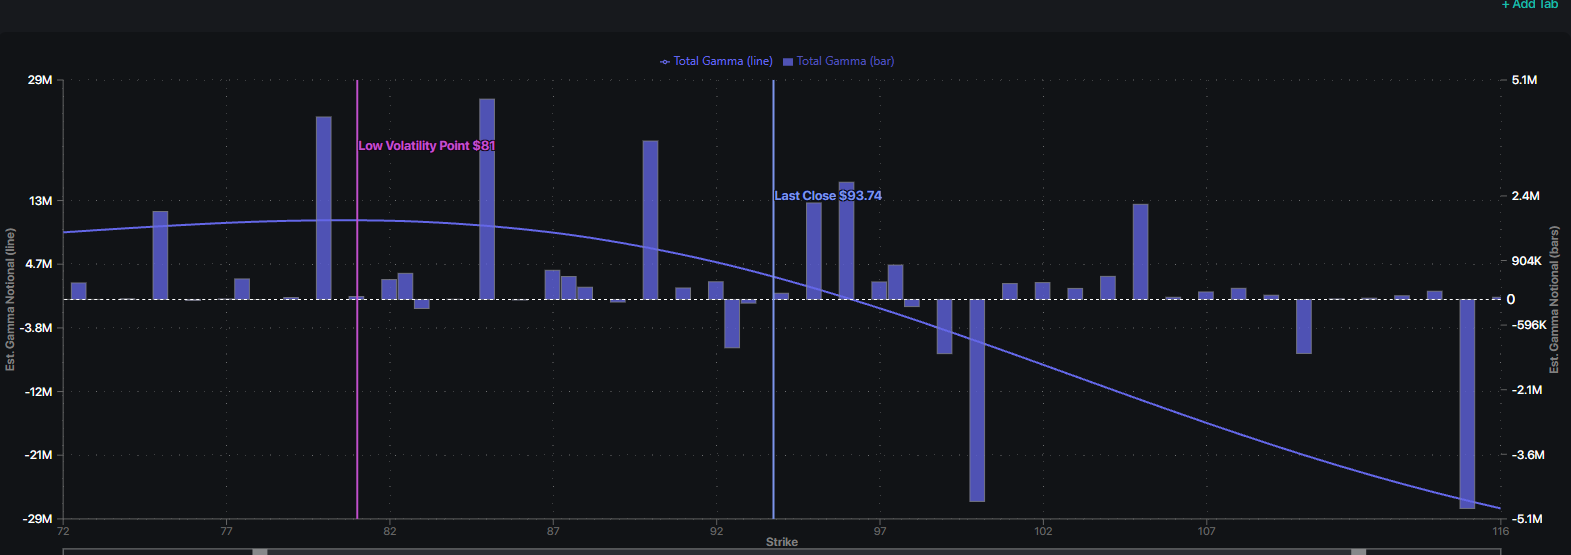
Intel’s updated SpotGamma Synthetic OI map shows positive aggregate gamma near current prices, but the gamma curve crosses into negative territory around $96-$97, potentially increasing volatility on an upside earnings reaction.
The largest nearby negative gamma concentration sits at $100, where dealer hedging could amplify directional movement if dealers are net short gamma. This contrasts with positive gamma concentrations around $94-$96, $90, and $85, which may help stabilize ordinary price fluctuations.
SpotGamma’s Low Volatility Point sits at $81, providing another downside positioning reference.
The Gamma Takeaway: A breakout through $97 toward $100 could produce accelerating upside volatility, while $90-$85 represents an important downside positioning zone. These are modeled exposures, and earnings gaps or post-event IV compression can quickly reshape dealer hedging dynamics.
4. What Wall Street Needs to See
Data center growth: Intel’s Data Center and AI business grew 59% year over year to $6.3 billion last quarter. Sustained demand for Xeon processors and enterprise AI infrastructure would strengthen the recovery narrative.
Foundry execution: Intel Foundry revenue rose 31% to $5.8 billion, although much of the activity came from internal manufacturing. Investors need evidence of improving yields, manufacturing efficiency, and progress toward meaningful external customer adoption.
Margins and guidance: Intel guided third-quarter revenue between $15.8 billion and $16.8 billion, with non-GAAP gross margin near 42% and adjusted EPS around $0.38.
Consensus revenue near $16.5 billion already implies performance toward the upper end of management’s range.
More importantly, fourth-quarter guidance, manufacturing profitability, and capital spending expectations may determine whether the market continues rewarding the turnaround.
5. Three Post-Earnings Trading Scenarios
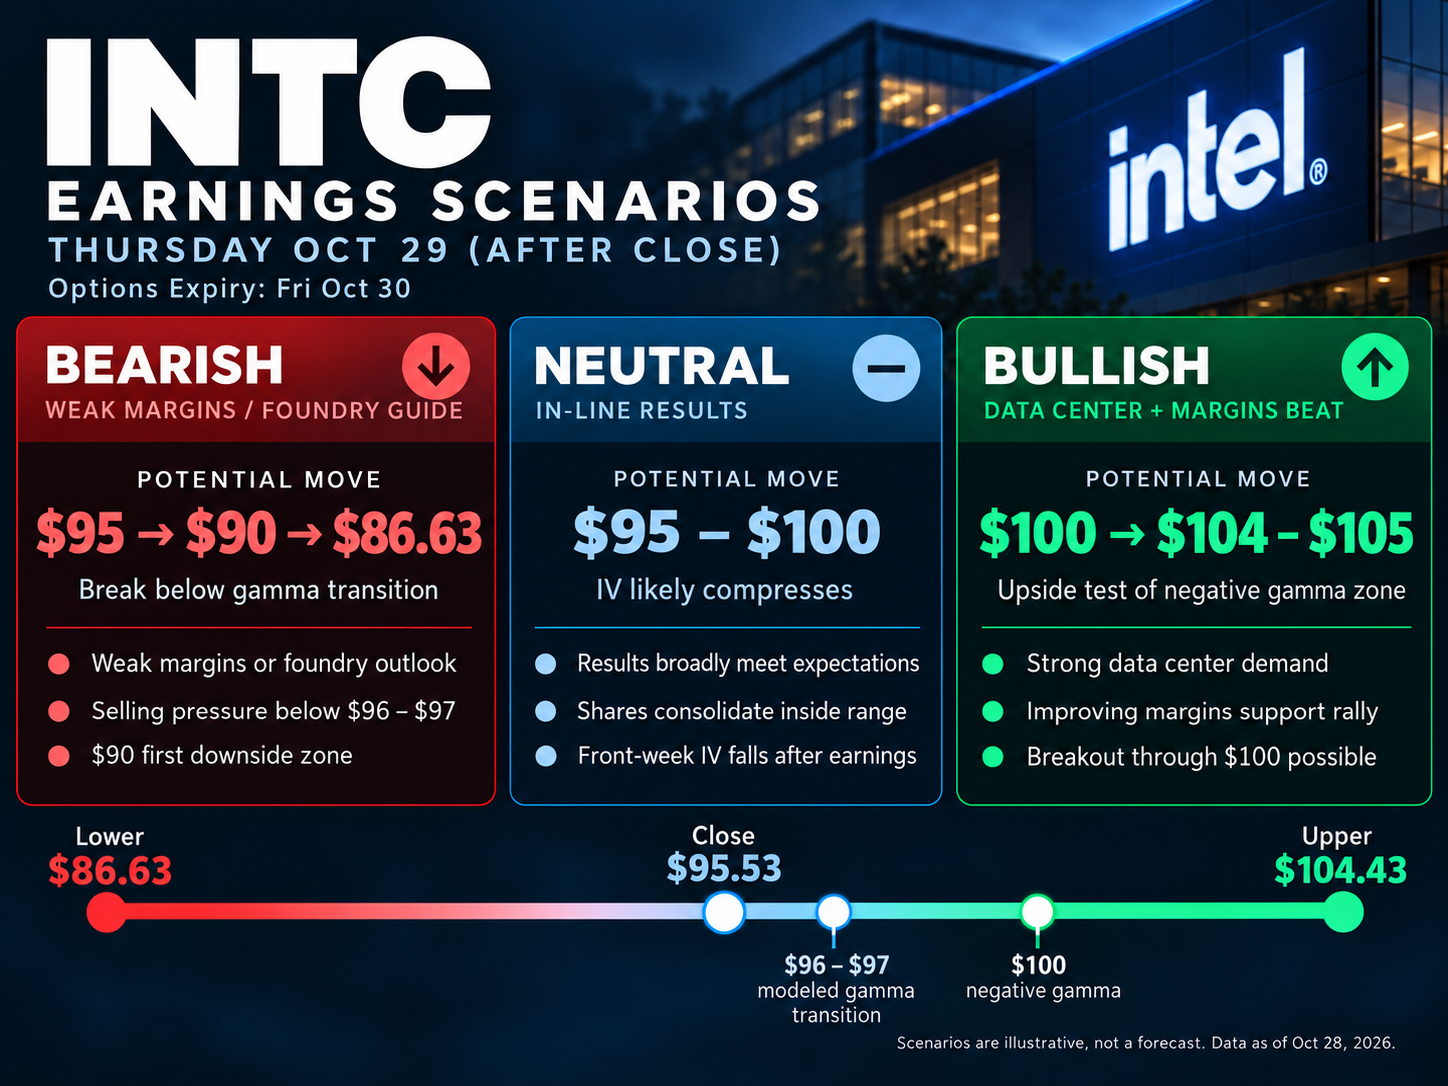
These levels represent conditional reaction zones, not guaranteed support, resistance, or price forecasts.
A bullish reaction would likely require a breakout through the $96-$97 gamma transition and then $100, which could open the door to the $104-$105 area. In-line results may keep shares contained around $95-$100 as front-week IV compresses, while weak margins or guidance could send INTC back toward $90 and then the lower implied boundary near $86.63.
6. Defined-Risk Options Trade to Consider
For traders anticipating a bullish earnings reaction, INTC’s November 6 $95/$105 call debit spread offers a defined-risk approach to participating in upside momentum while reducing the cost of elevated options premiums.
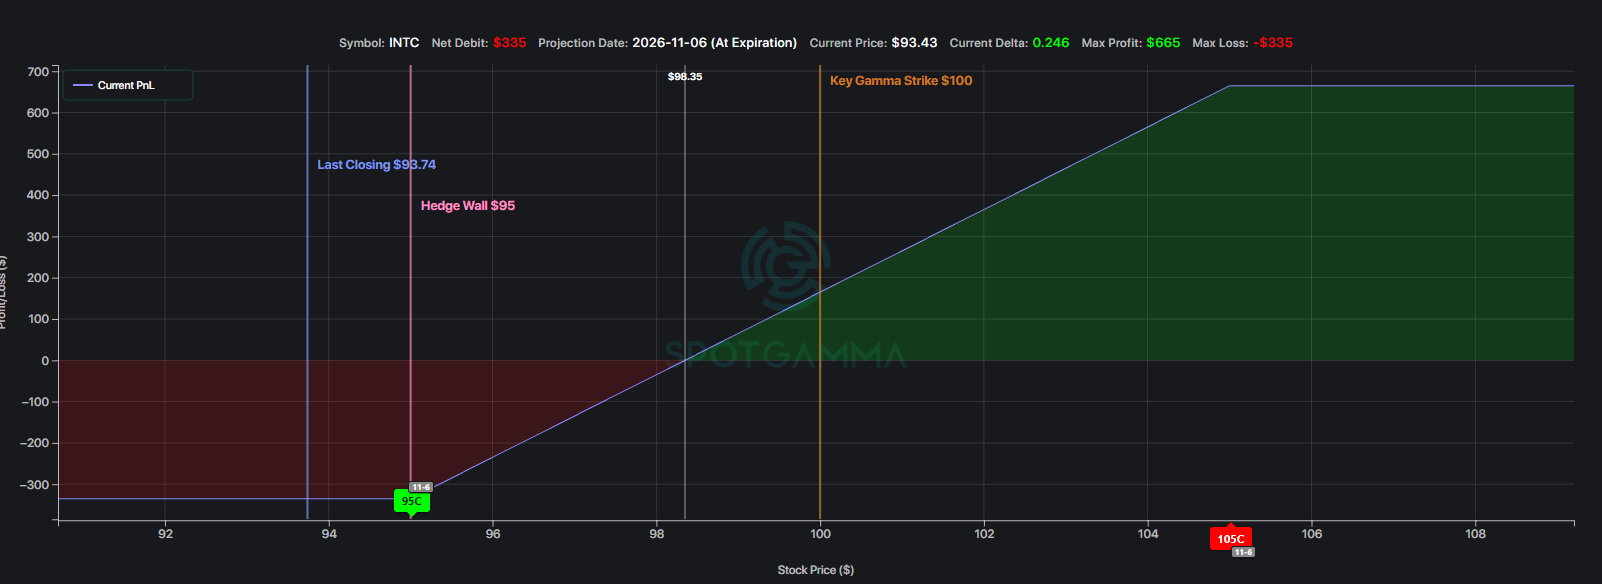
The structure is particularly interesting given the negative gamma concentration around $100, where a strong earnings surprise could trigger more aggressive dealer hedging if dealers are net short gamma. Selling the $105 call provides a logical upside cap near the upper implied-move boundary, while the additional week to expiration allows time for potential post-earnings follow-through.
At a $3.35 debit, the spread risks $335 to potentially earn $665, with an expiration breakeven near $98.35. Actual pricing must be confirmed before entry.
The takeaway: This structure offers controlled exposure to a potential upside breakout through $100 without purchasing expensive outright calls. A disappointing report or insufficient rally can still result in the loss of the entire debit, and post-earnings IV compression remains an important risk.