Amazon enters earnings with investors asking whether accelerating AWS demand can justify aggressive AI infrastructure spending. AWS revenue grew 37% year over year last quarter, but operating margins, capital expenditure, and free cash flow may matter as much as cloud growth. For options traders, the question is whether the reaction will exceed a substantial event premium.
1. What Is the Options Market Pricing?
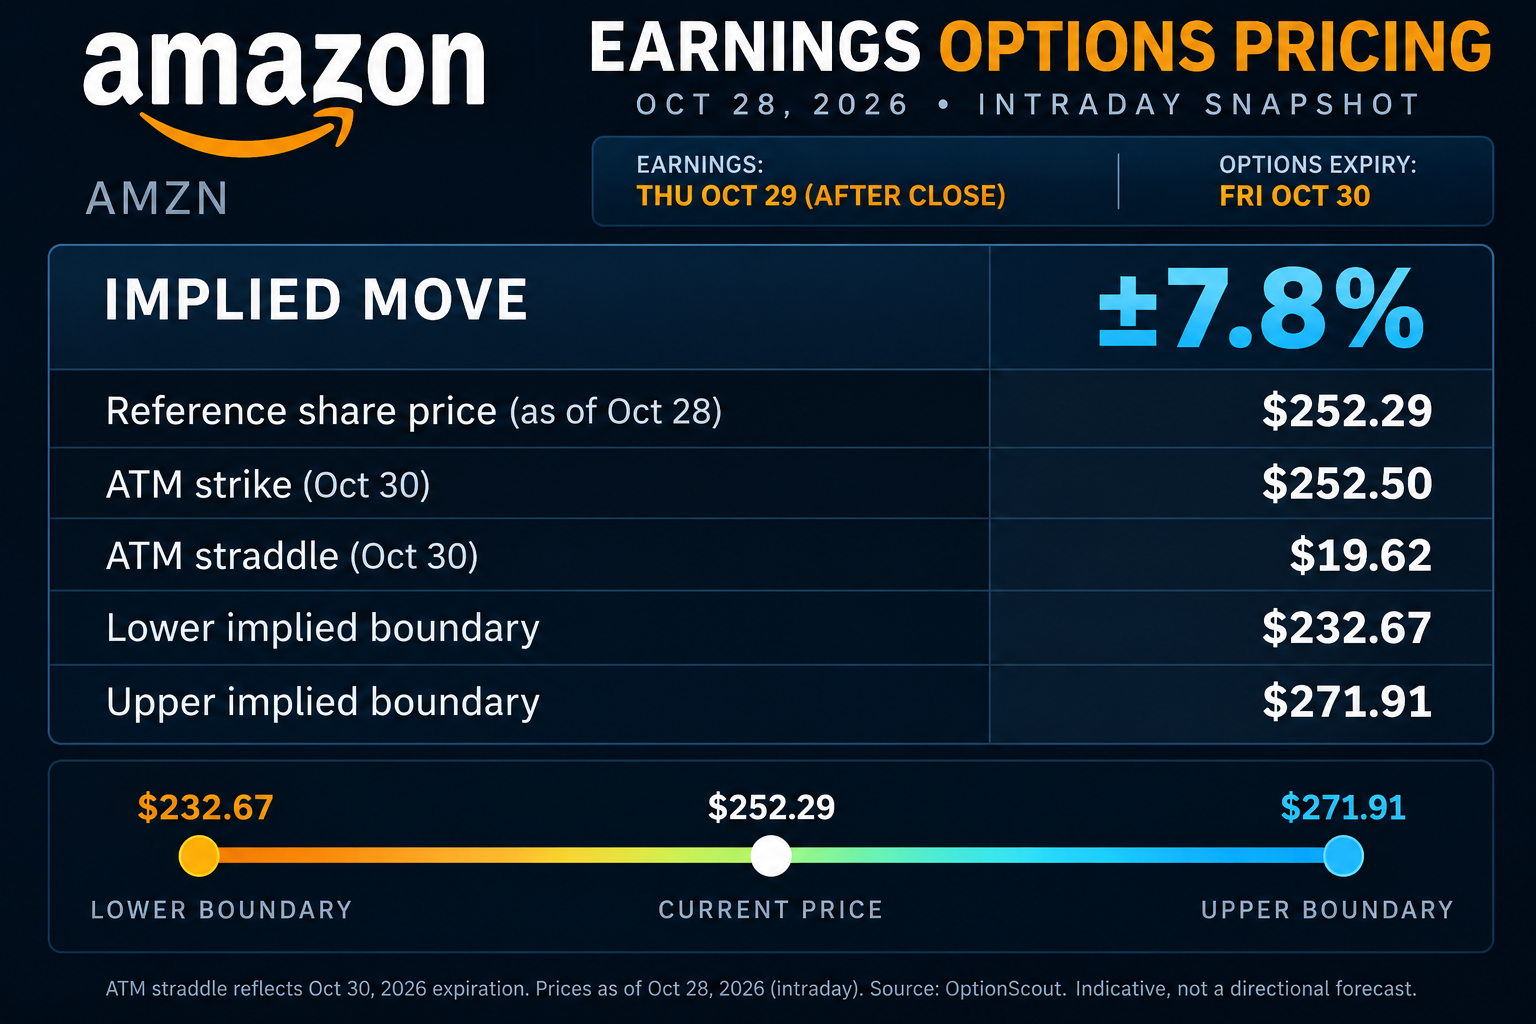
October 28 quotes put the October 30 at-the-money straddle near $19.60, implying approximately ±7.8% from a reference price around $252. The resulting indicative range is roughly $233-$272.
Across the previous eight earnings reports, AMZN’s average absolute next-session move was about 6.2%, below today’s implied move. Yet the sample includes a 15.3% gain after July 2026 earnings, a 9.6% rise after October 2025, and an 8.3% decline after July 2025. Buying volatility therefore demands a meaningful surprise, while selling it still carries material gap risk.
2. Volatility Skew: Downside Protection Is Expensive
SpotGamma’s updated 30-day skew shows at-the-money IV near 43–44%, rising toward 49% around the $200 put strike and higher at deeper downside strikes. The call wing is much flatter, with volatility bottoming near $275–$280 before edging upward.
This relative pricing may favor evaluating defined-risk put credit spreads or call debit spreads over outright long puts or calls. However, the chart covers 30-day volatility in teal and the Oct 30 weekly expiration shown below in grey, where earnings premium and post-event IV compression are more concentrated.
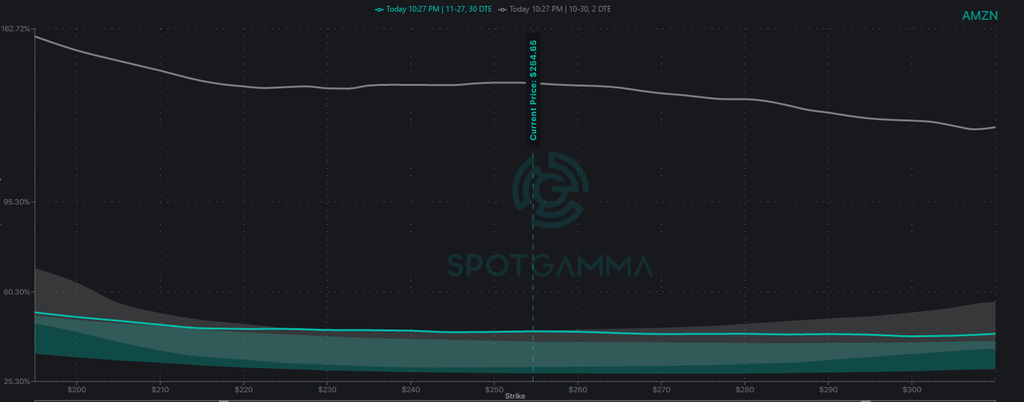
AMZN 30-day skew: at-the-money IV near 43–44%, rising toward 49% around the $200 put strike, with a much flatter call wing. Source: SpotGamma
3. Dealer Gamma: $265 Is the Key Upside Test
The updated SpotGamma Synthetic OI map shows positive modeled aggregate gamma near AMZN’s $253 reference price, with the Low Volatility Point around $282.50. Positive strike concentrations near $240 and $250–$255 may moderate ordinary price fluctuations if dealers are net long gamma.
The largest negative strike-level concentration is near $265, within a broader $260–$270 pocket. A strong upside earnings gap into this area could reinforce directional hedging if dealers are short gamma there. Larger positive concentrations near $280 and $290 may then slow the advance; $282.50 is another reference point.
On the downside, $240 is an important positive-gamma strike, while the approximately $233 lower implied boundary lies beneath it.
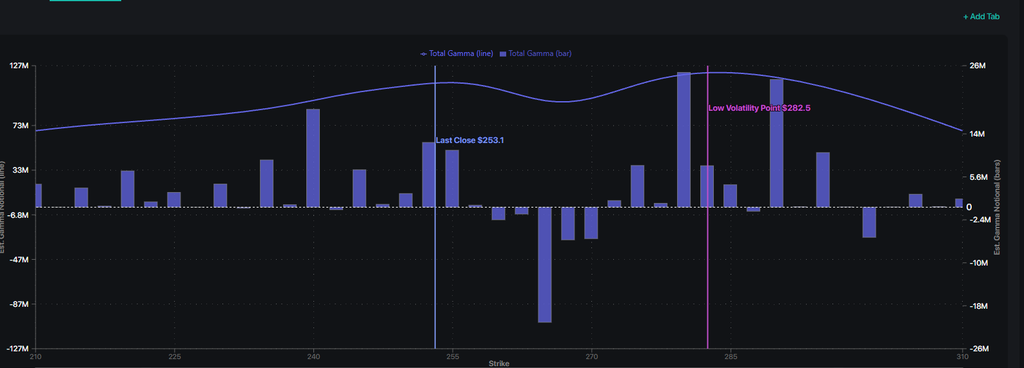
AMZN Synthetic OI gamma map: positive gamma near $240 and $250–$255, the largest negative concentration near $265, and larger positive concentrations near $280 and $290. Source: SpotGamma
4. What Wall Street Needs to See
AWS momentum: Revenue reached $42.2 billion last quarter, up 37%. Investors will assess whether growth can approach 40% without sacrificing profitability.
AI spending and cash flow: Heavy spending on data centers, custom chips, and compute pushed trailing free cash flow negative in the June quarter. Evidence of improved returns on those investments will matter.
Guidance and operating margins: Amazon guided third-quarter revenue to $197-$202 billion and operating income to $22.5-$26.5 billion. Consensus revenue near $202.1 billion already implies a result near the high end. Because prior earnings included non-operating investment gains tied primarily to Anthropic, AWS margins, operating income, and forward guidance may be cleaner signals than headline EPS.
5. Three Post-Earnings Trading Scenarios
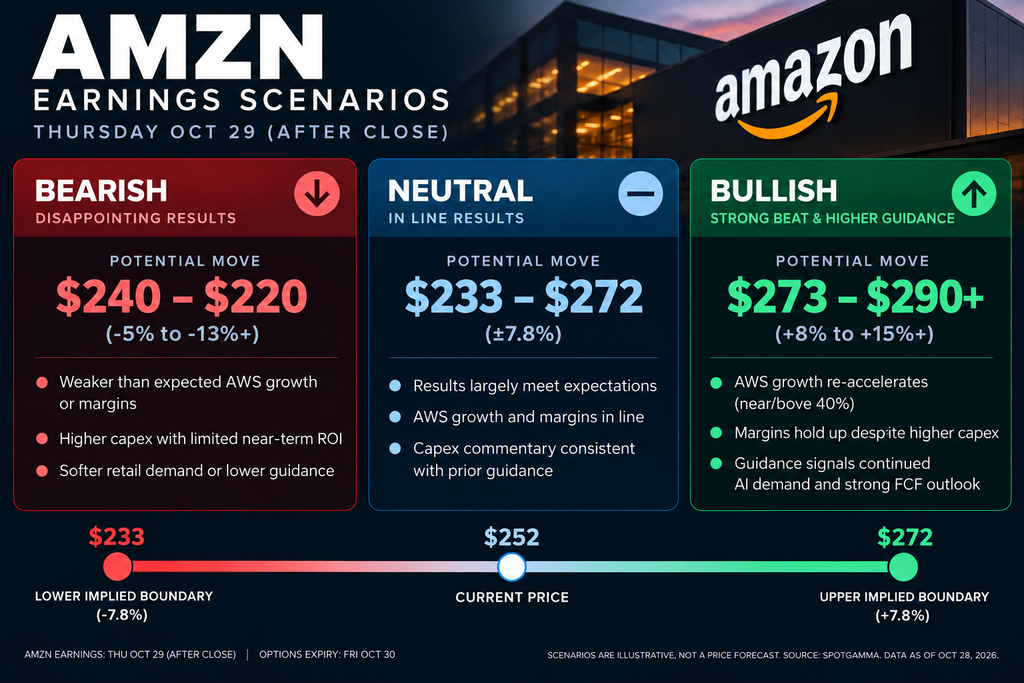
Bullish, in-line and bearish post-earnings scenarios for AMZN.
A bullish AWS and margin surprise could lift shares through $265 toward $280-$290. In-line results may leave AMZN inside the roughly $233-$272 implied range as front-week IV falls. Weak cloud margins, heavy spending, or soft guidance could bring $240 and then $233 into focus. These are scenario levels, not price forecasts.
6. Defined-Risk Trade to Consider
For a bullish thesis, consider the November 20 $260/$280 call debit spread. The October 28 indicative $6.16 debit implies $616 maximum risk, $1,384 maximum potential gain, and a $266.16 breakeven at November expiration—a roughly 2.25:1 maximum reward-to-risk ratio.
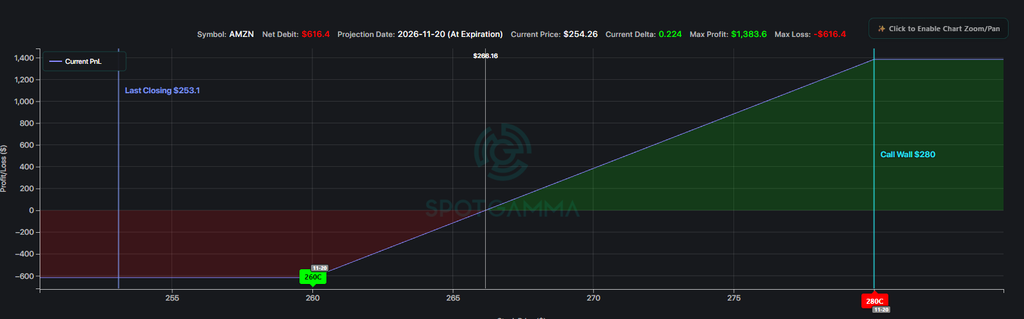
Risk graph for the November 20 $260/$280 call debit spread: $6.16 indicative debit, $616 maximum risk, $1,384 maximum potential gain and a $266.16 breakeven.
The $265 negative-gamma zone gives the trade a possible acceleration catalyst, while $280 is a logical upside cap near a large positive-gamma concentration. Selling the $280 call reduces upfront premium versus owning the $260 call outright. The later expiration also allows the thesis more time to develop, though it adds market exposure beyond earnings.
A weak report or insufficient rally can still erase the entire debit at expiration. Actual spread quotes, bid/ask width, early exit prices, and post-earnings IV changes will affect realized returns; the October 30 implied range is not a November 20 forecast.
Also notable to the bullish case is a recent large buyer on October 6th for 60,000 January $275/$300 call spreads that remain in open interest. AMZN also tends to have stronger seasonality in November and the Q4 timeframe so there are some factors in play for a bullish surprise for a stock that is essentially flat for the year of 2026.
Bottom line: AMZN’s opportunity is not simply predicting an AWS beat. It is identifying whether the expected stock move, volatility premium, and changing gamma landscape justify the limited risk taken.