Wednesday evening brings one of the most consequential earnings events of the quarter as Alphabet and Microsoft report results within an hour of each other.
Both companies sit at the center of the artificial intelligence investment cycle, investing heavily in data centers, computing capacity, and cloud infrastructure.
Yet investors are increasingly asking the same question: When will unprecedented AI spending translate into sustainable returns?
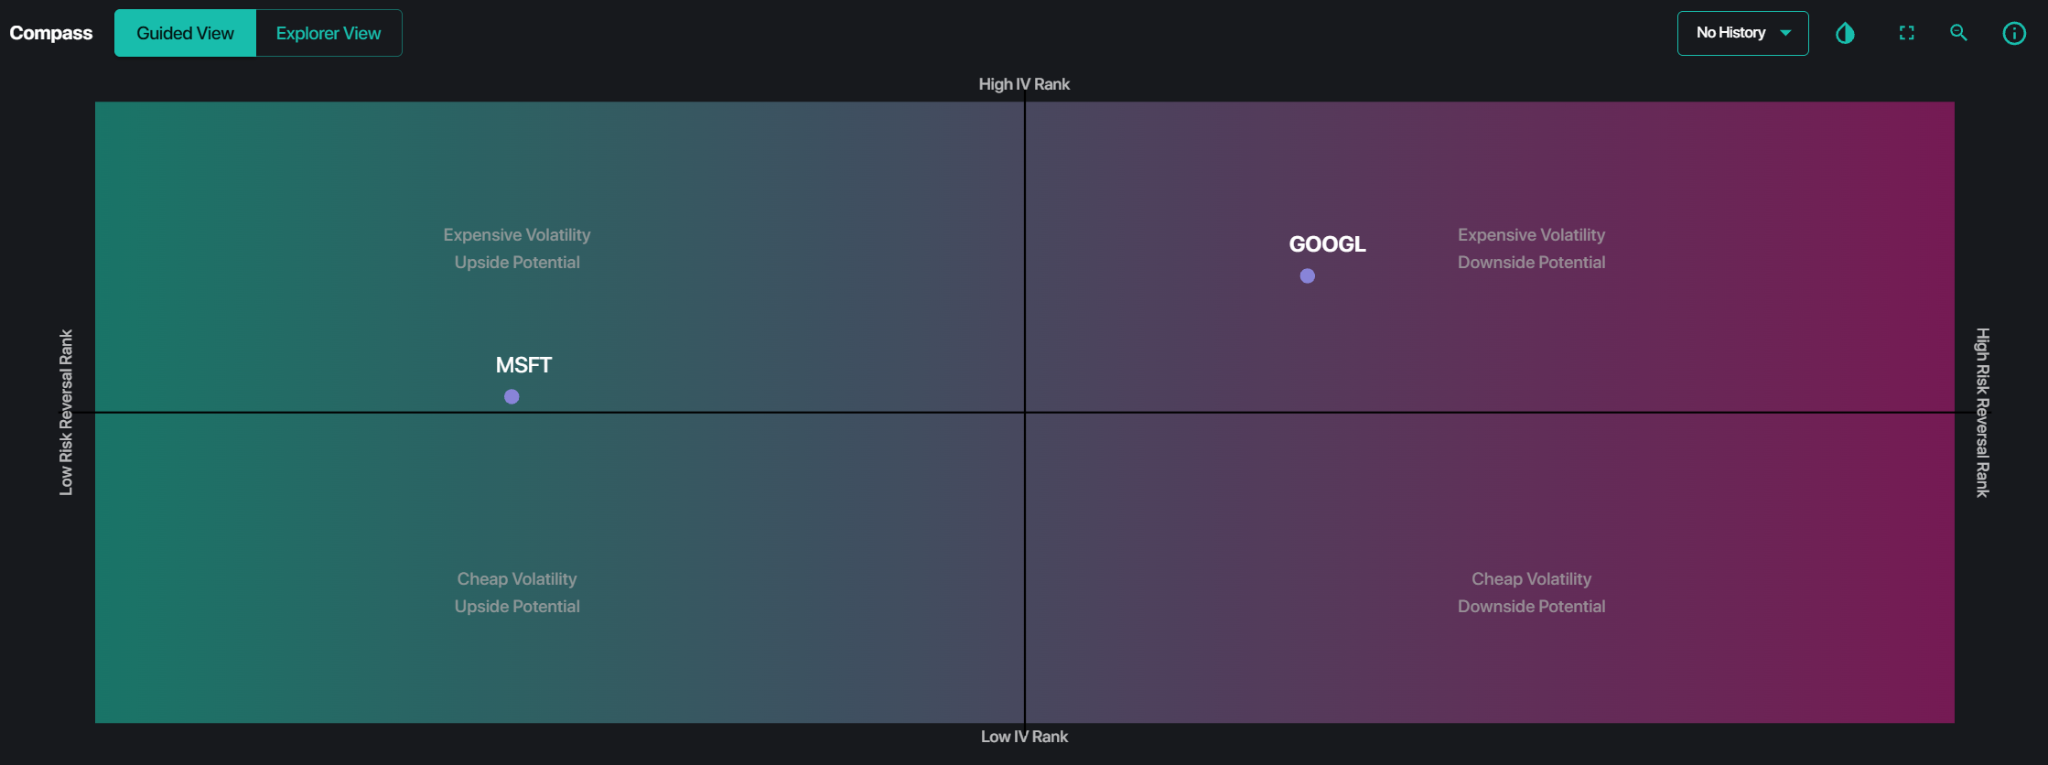
For options traders, the setup is particularly interesting. GOOGL options are pricing approximately a 5.8% move, while MSFT is pricing around 5.1%.
Despite their similarities, historical earnings volatility and dealer positioning suggest two different opportunities.
1. What Is the Options Market Pricing?
The October 30 weekly expiration captures both earnings announcements, alongside Wednesday’s Federal Reserve decision.
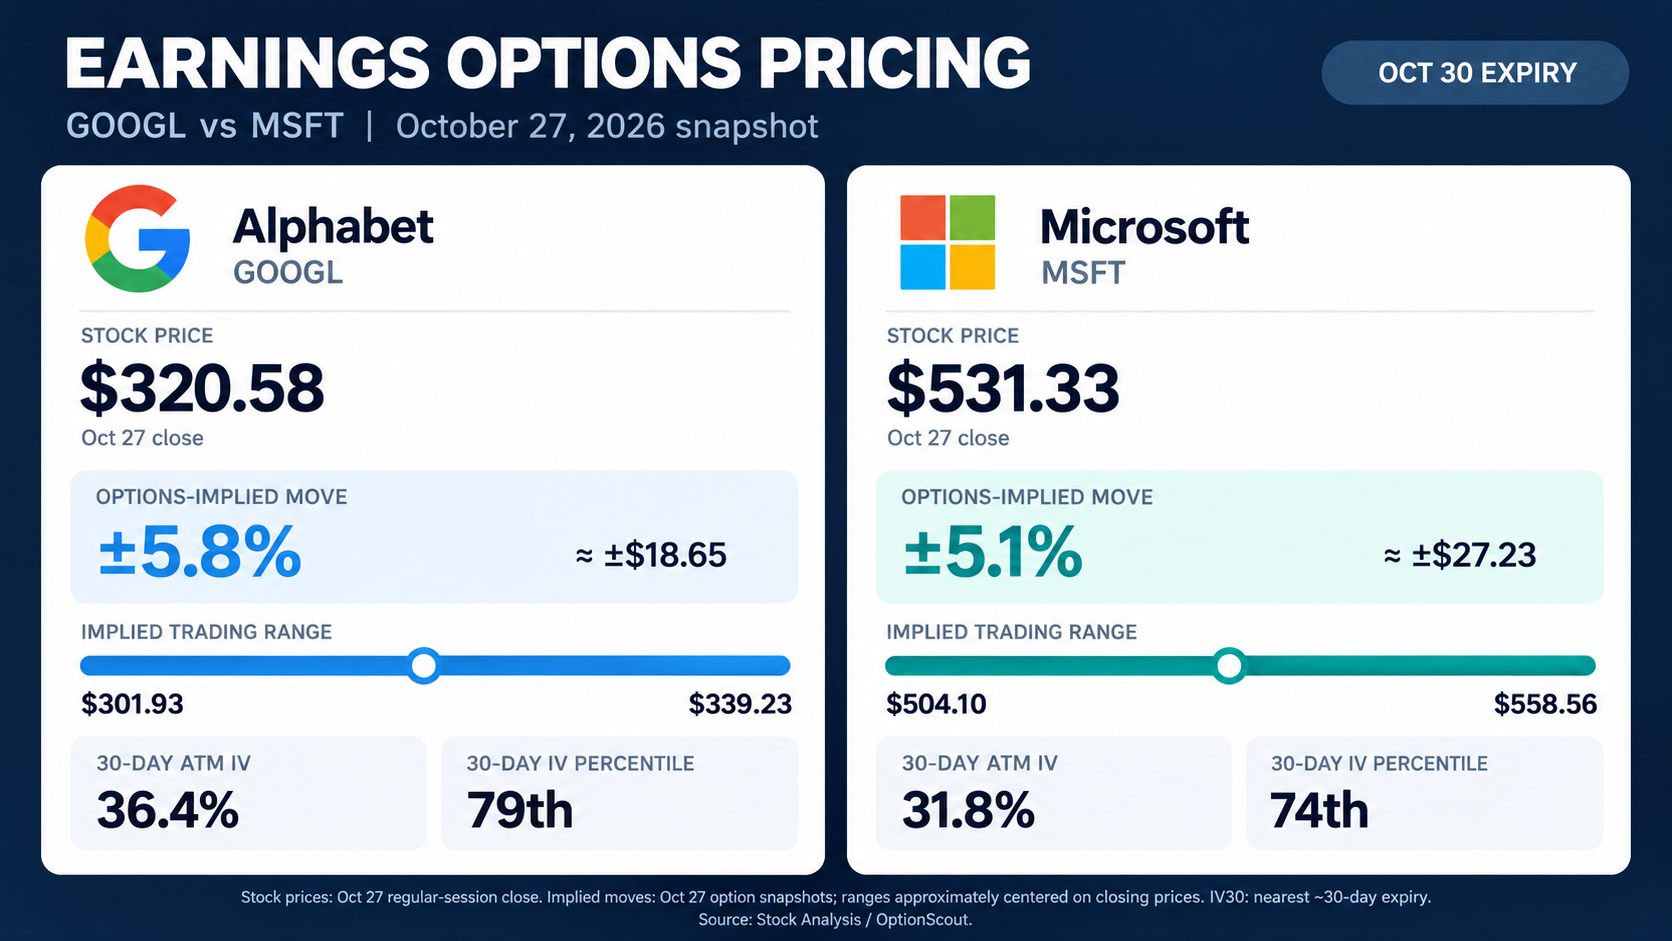
Both stocks exhibit elevated near-term implied volatility, with October 30 contracts carrying substantial event premiums relative to longer-dated options.
However, the historical comparison reveals an important distinction.
Historical Earnings Moves Versus Expectations
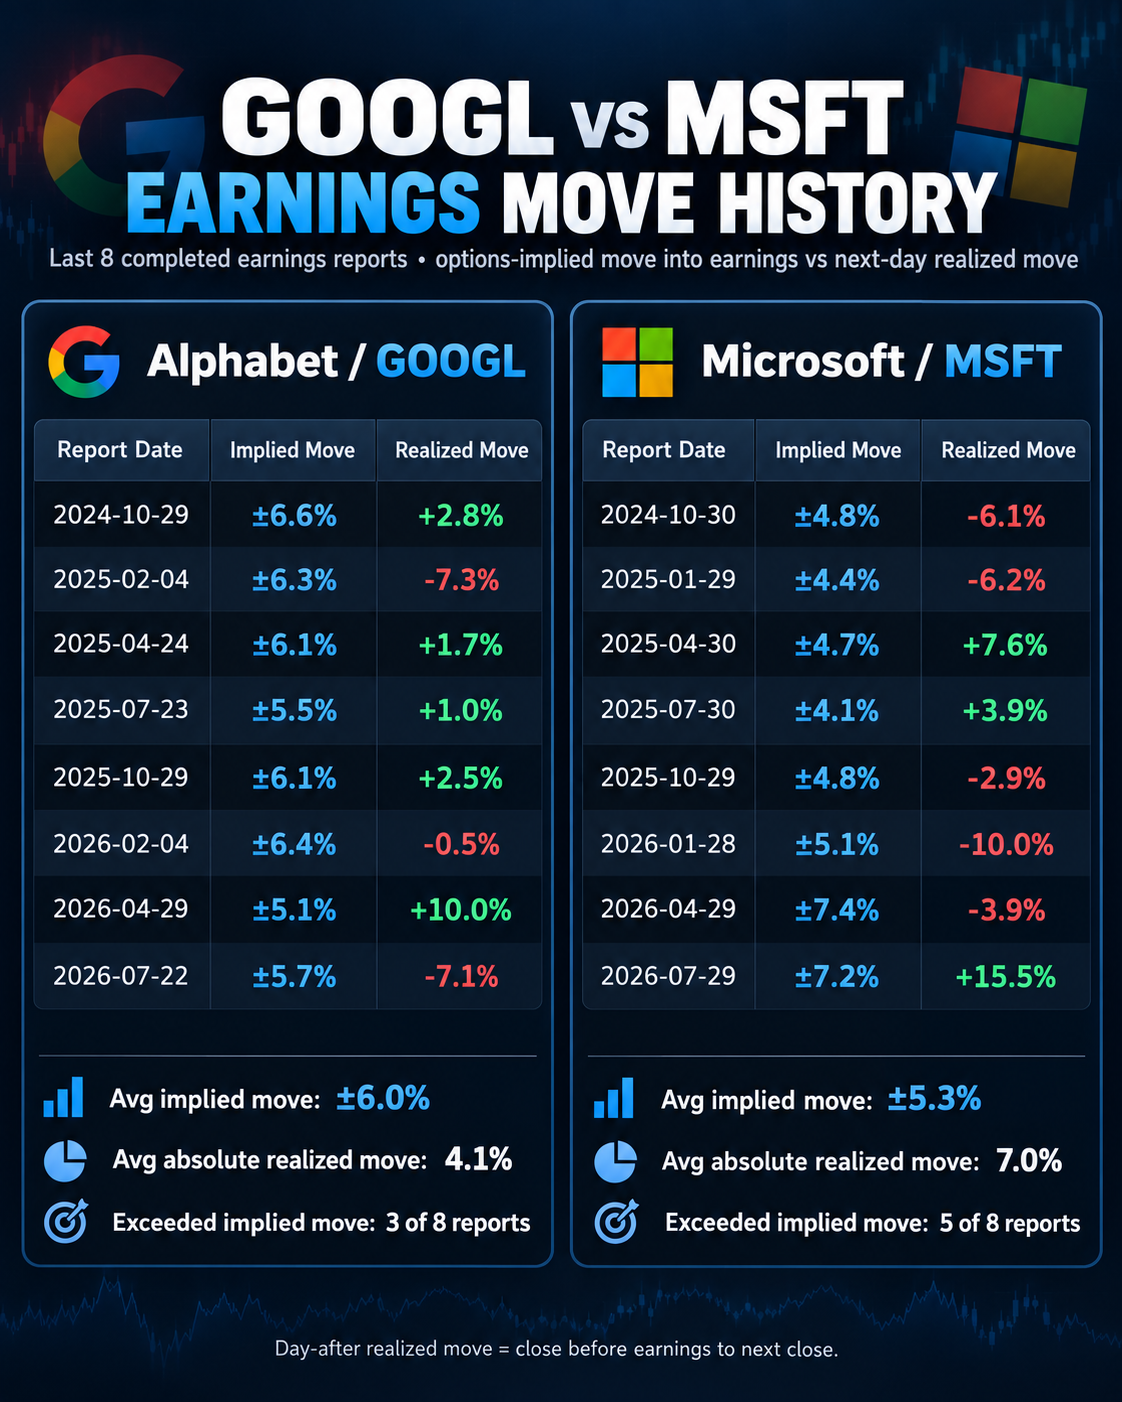
GOOGL’s average realized earnings move has historically fallen short of options expectations, while MSFT’s recent reactions have been more explosive, frequently exceeding the implied range. That contrast makes their relative volatility pricing particularly interesting.
This suggests that applying identical earnings strategies to both stocks may overlook meaningful differences in realized volatility.
2. Volatility Skew: Where Are Traders Hedging?
The volatility surfaces reinforce these differences.
GOOGL’s 30-day 25-delta put skew carries approximately a 1.9-volatility-point premium over comparable calls.
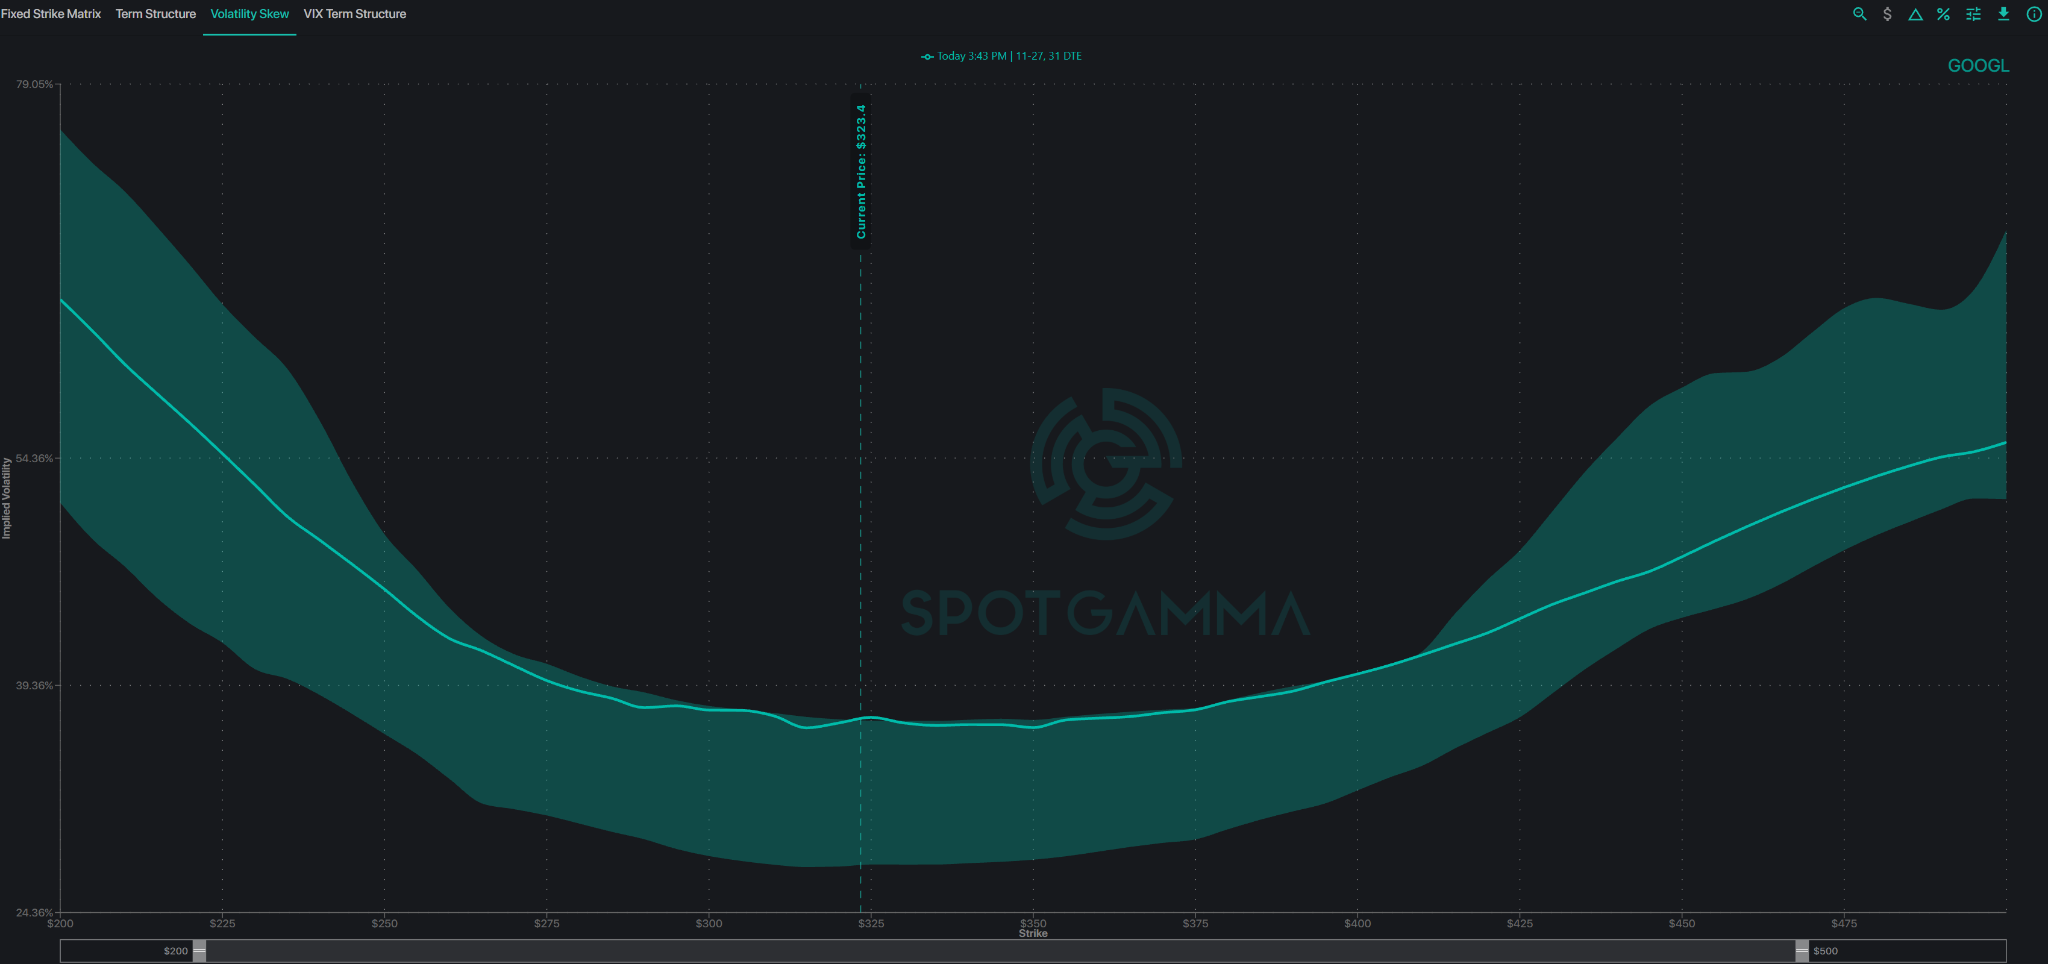
Microsoft’s downside skew is considerably steeper, with puts commanding roughly 3.3 volatility points more than calls.
This indicates stronger relative demand for downside protection in MSFT, despite its lower overall implied volatility.
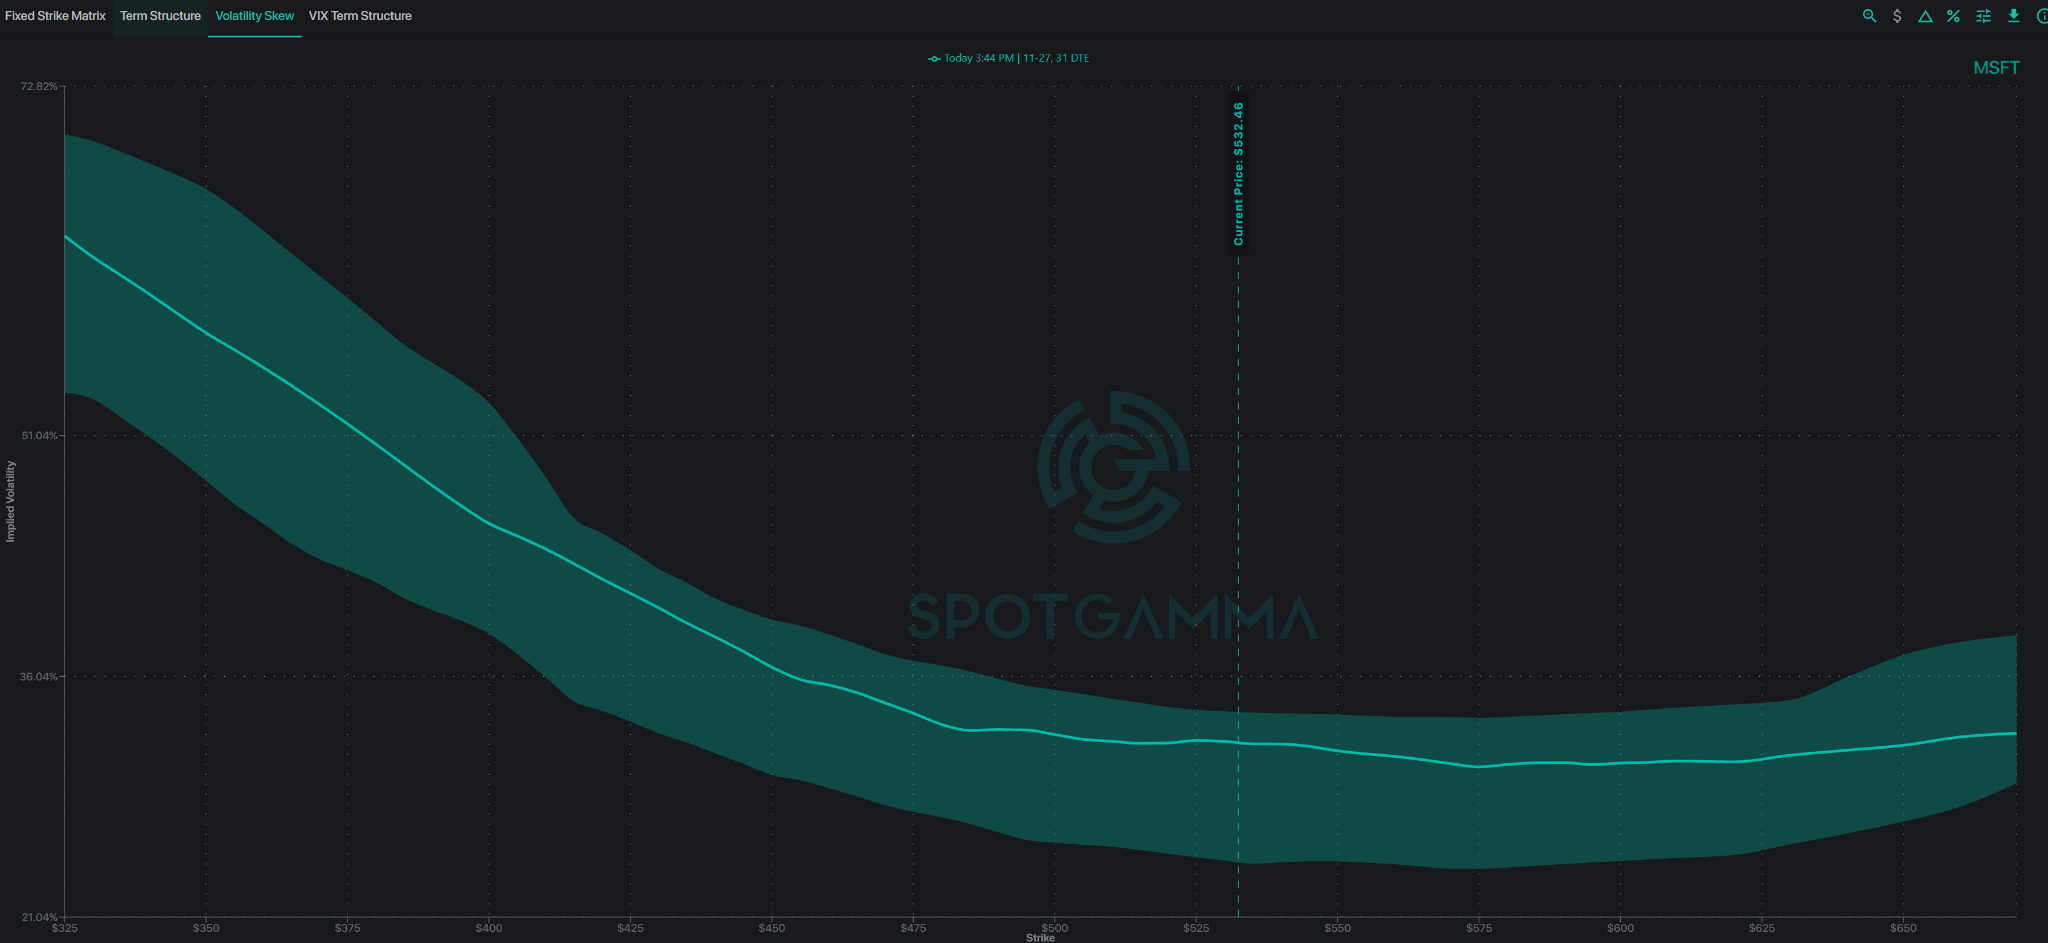
For traders, elevated put skew makes bearish protection more expensive while potentially improving the relative pricing available to put-spread sellers.
Meanwhile, both stocks face meaningful post-earnings IV compression, particularly in Friday’s weekly expiration.
The distinction: GOOGL’s historical pattern supports examining defined-risk short-volatility structures, whereas MSFT’s realized volatility history makes outright premium selling less compelling without sufficient credit.
3. Dealer Gamma: Key Levels Shaping the Earnings Reaction
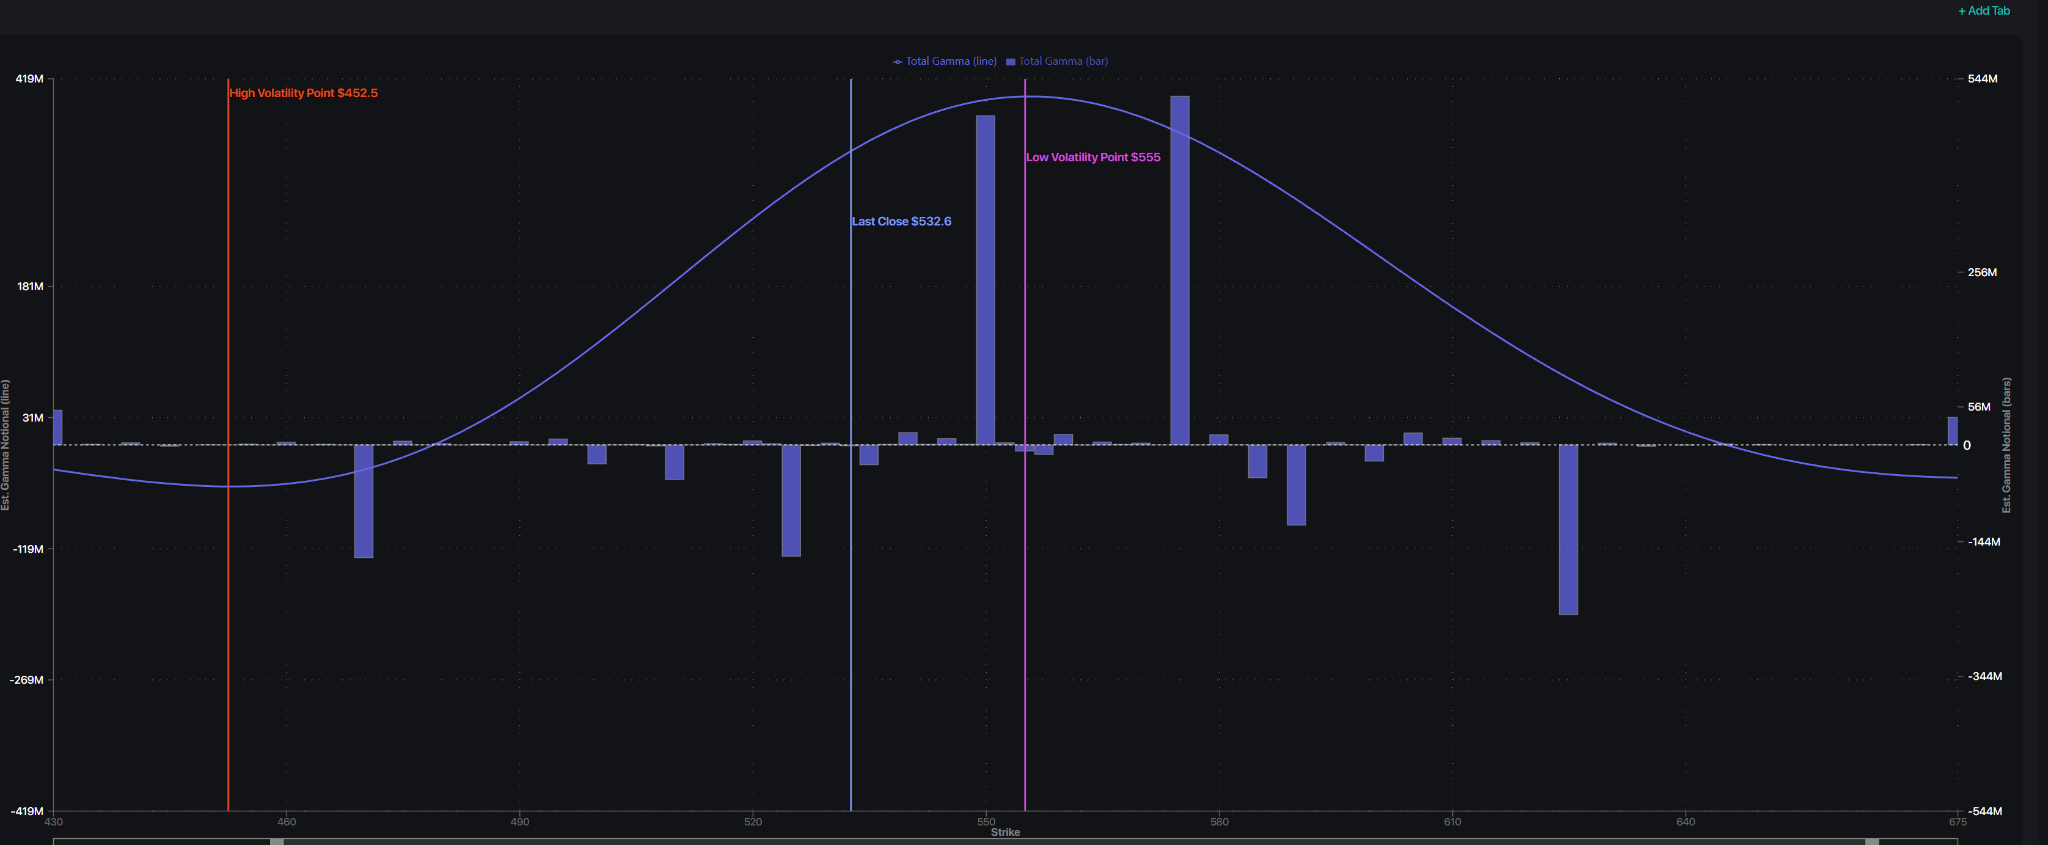
Both Synthetic OI maps show positive modeled gamma near spot, which could dampen moderate price moves if dealers are net long gamma.
MSFT: The $550-$575 Upside Concentration
Near $532, MSFT trades below its $555 Low Volatility Point. Large positive gamma concentrations at $550 and $575 surround the $559 upper implied-move boundary, potentially slowing a modest earnings rally. Negative strike-level gamma near $525 remains a downside level to monitor.
GOOGL: $302.50 Below, $340 Above
Near $320, GOOGL trades above its $302.50 Low Volatility Point. Positive gamma around $315-$320 and $340 may provide stabilizing flows.
The $340 concentration sits just beyond the $339 upper implied boundary; above roughly $365, aggregate gamma turns negative, raising the potential for amplified upside moves toward $370.
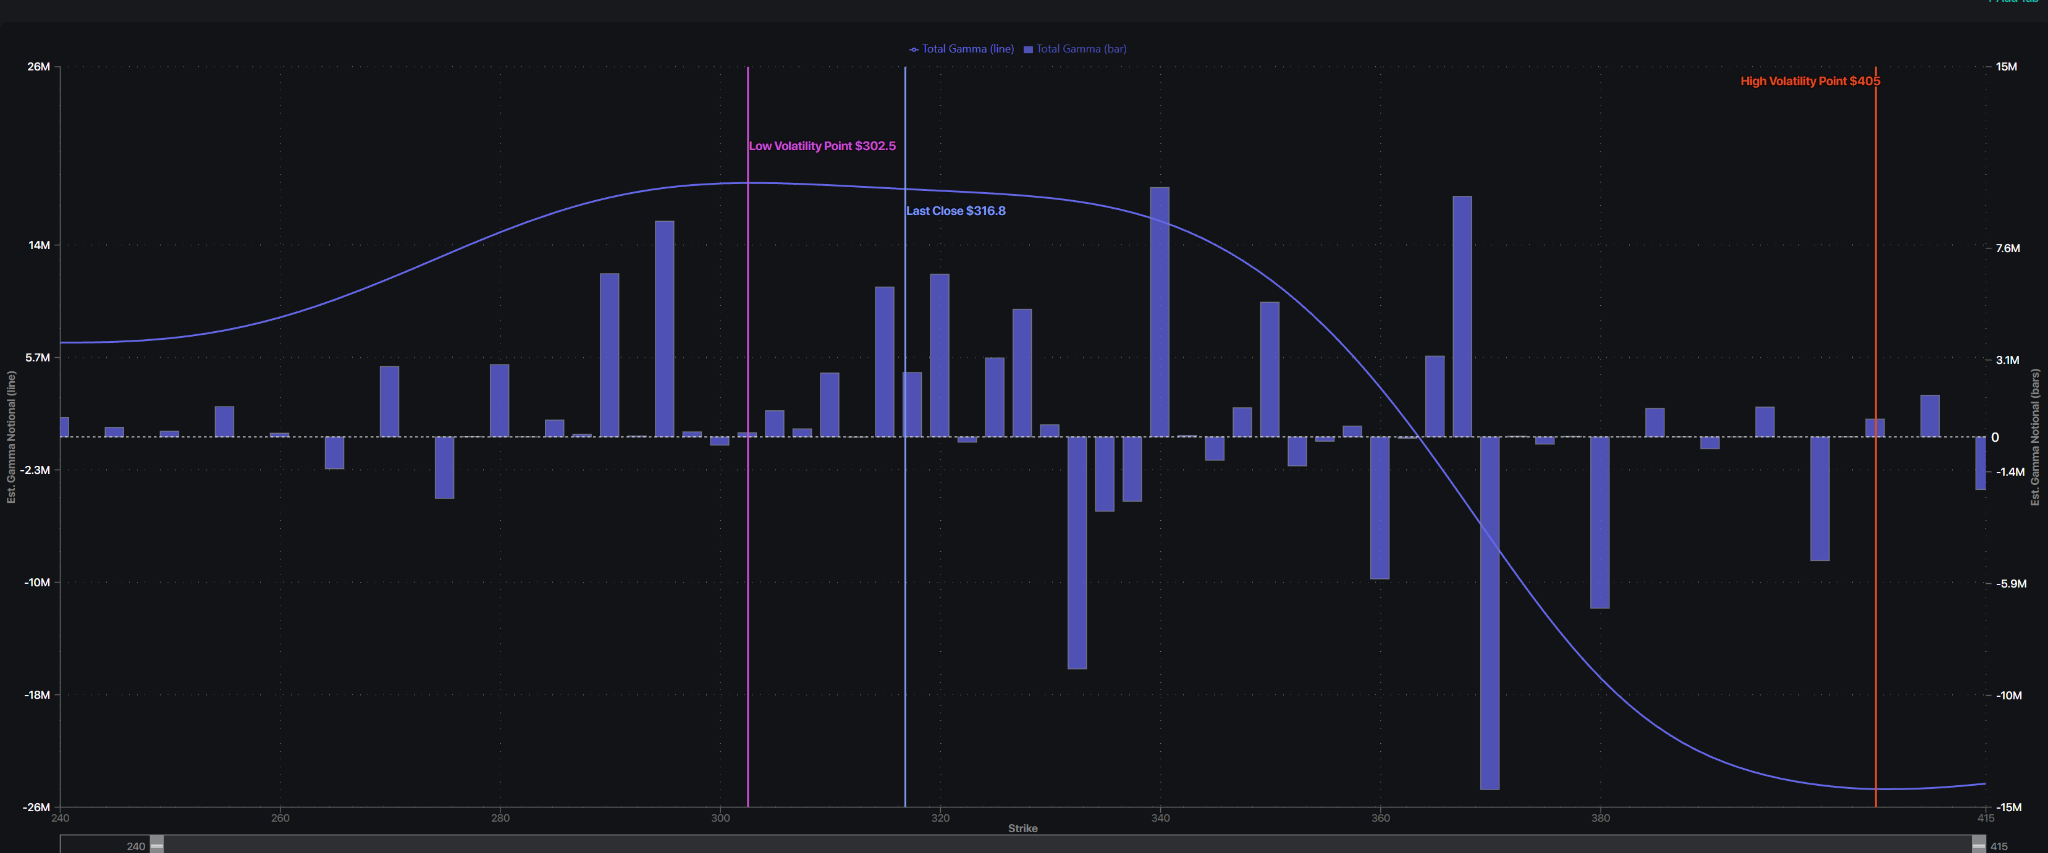
The Gamma Takeaway: Both stocks may encounter stabilizing hedging near major gamma strikes, but earnings surprises can overwhelm these concentrations. SpotGamma’s Synthetic OI model calculates gamma exposure based on dealer positioning.
4. What Wall Street Needs to See
Both companies face mounting pressure to demonstrate that AI infrastructure investment is creating shareholder value.
Alphabet: Cloud Growth Versus Spending
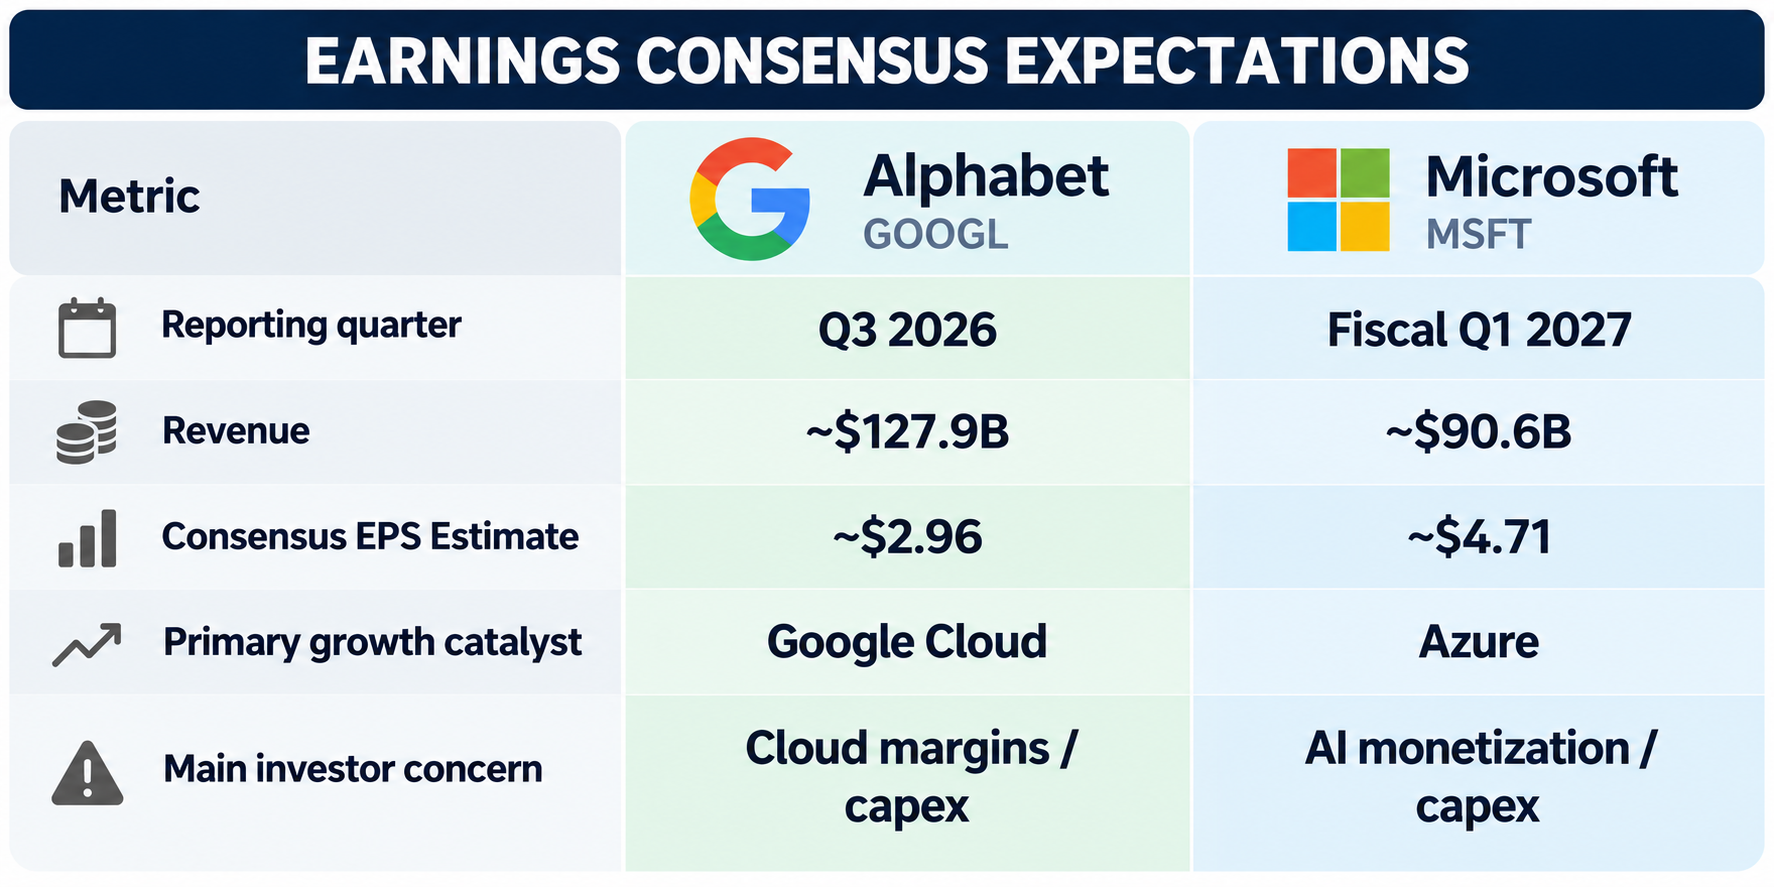
Google Cloud revenue surged 82% in the previous quarter. Wall Street now expects approximately $29.2 billion in quarterly Cloud revenue.
Investors will focus on whether that momentum continues while margins withstand higher infrastructure costs.
Alphabet’s previously discussed $195-$205 billion 2026 capital expenditure outlook also remains central to the investment debate.
Microsoft: Azure and AI Monetization
Microsoft guided Azure growth near 45% in constant currency, while consensus expectations are closer to 48%, raising the bar for an upside surprise.
The bigger question concerns profitability.
With quarterly capital spending expected to exceed $50 billion, investors need evidence that Azure growth, Copilot adoption, and enterprise AI demand can support accelerating investment.
Guidance may ultimately matter more than headline earnings beats for both companies.
5. Three Post-Earnings Trading Scenarios
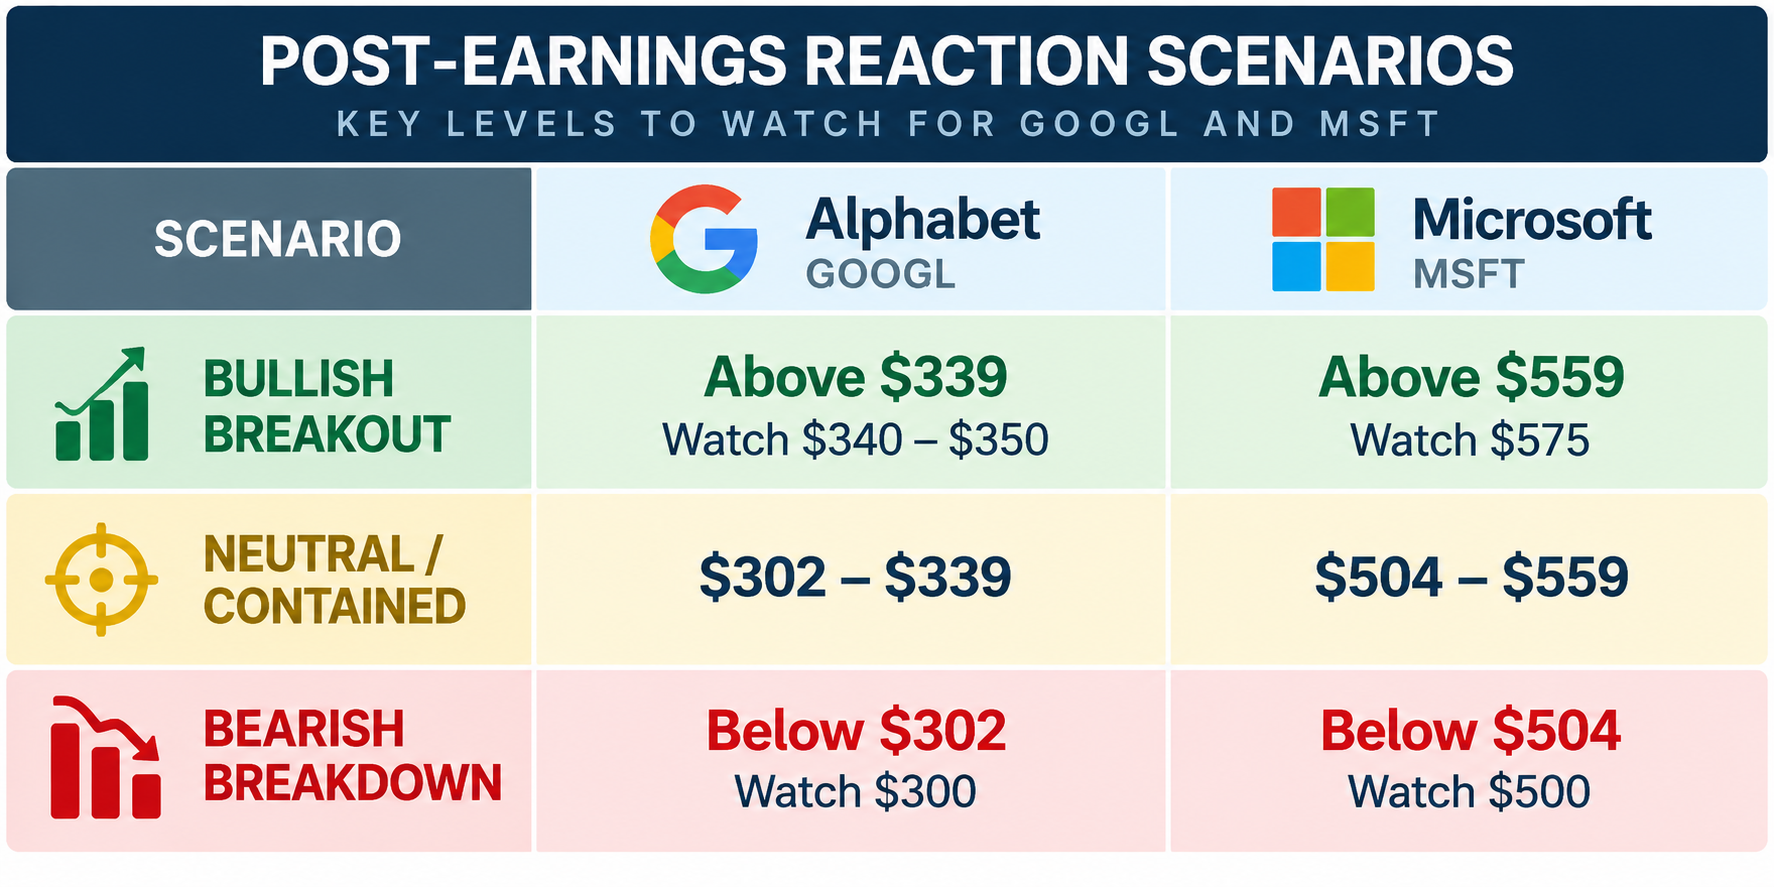
Bullish: Strong cloud growth and reassuring capex commentary could drive both stocks beyond their implied ranges. Breakouts may encourage directional hedging and momentum.
Neutral: Results largely matching expectations could produce significant volatility compression. Defined-risk premium-selling strategies may benefit if prices remain contained.
Bearish: Disappointing margins, weaker cloud guidance, or additional spending commitments could trigger selling pressure. A breakdown through major put concentrations would increase the risk of downside acceleration.
6. The Options Trader’s Takeaway
Two AI hyperscalers, one earnings night, and two distinctly different volatility profiles.
GOOGL’s history of relatively contained earnings reactions favors examining defined-risk premium-selling structures, particularly if positive gamma continues to stabilize price around major strikes. Although GOOGL has notable negative gamma fuel above 365 if it were to really ignite higher beyond its implied move.
MSFT offers a different setup. Its recent realized earnings volatility has exceeded options expectations, suggesting that defined-risk long-gamma structures may deserve greater attention if traders anticipate another meaningful surprise.
But both stocks face substantial post-earnings IV compression. The opportunity isn’t simply predicting which stock beats estimates—it’s identifying where realized movement could exceed the volatility already priced into options.
Owning gamma into earnings requires realized movement exceeding the premium paid, with post-event IV compression remaining a major consideration. Short-gamma exposure becomes especially dangerous if spot moves into negative-gamma regions or beyond sizable strike concentrations.
Bottom line: GOOGL’s historical volatility profile favors evaluating defined-risk premium selling, while MSFT offers a stronger argument for owning convexity. But elevated IV, event risk, and dealer positioning all matter. The opportunity lies in finding where the expected realized movement justifies the premium paid or received.