Rising volatility, dealer gamma exposure, and upcoming catalysts could determine whether markets stabilize or face another wave of selling.
When Volatility Becomes the Catalyst
Wall Street’s fear gauge is surging, technology stocks are under pressure, and investors are confronting a dramatically different trading environment.
Thursday’s sharp reversal more than erased Wednesday’s post-midterm rally. The S&P 500 fell 4.36% close-to-close to 7,353.73, its largest single-day decline since August 2011 outside of the 2020 Covid crash and the April 2025 tariff shock. The Nasdaq Composite dropped 5.52% and closed in correction territory, more than 10% below its Oct. 6 record, while the Nasdaq-100 sank 6.36% for its worst session since March 2020.
Semiconductor and AI infrastructure stocks took the brunt of the selling. The Philadelphia Semiconductor Index plunged more than 12%, and the S&P 500’s information technology sector lost 7.3%, its worst day since March 2020. Micron, Sandisk, and AMD each fell more than 16%, Nvidia dropped 9.3%, and data center operators IREN, Applied Digital, and Nebius each lost more than 14%. The weakness spread well beyond chips: Tesla fell 10.8%, and all 11 S&P 500 sectors finished lower.
The Cboe Volatility Index (VIX) jumped roughly 70%, its biggest one-day surge in almost two years, and reached an intraday high of 28.36 on Thursday, highlighting how quickly investors repriced market risk.
But the magnitude of the decline tells only part of the story.
Beneath the surface, options positioning, dealer hedging, and volatility-sensitive strategies can create a feedback loop where declining prices generate additional selling pressure.
With inflation releases and November options expiration approaching, the next two weeks could determine whether this is a temporary volatility shock or a more persistent shift in market behavior.
Negative Gamma: Why Declines Can Accelerate
One of the most important dynamics during corrections involves dealer gamma exposure.
Gamma measures how quickly an option’s delta changes as the underlying asset moves. Dealers adjusting their hedges can either dampen or reinforce price movements.
When dealers are long gamma, hedging works against market direction. They buy declines and sell rallies, dampening volatility.
When dealers are short gamma, the opposite occurs. Hedging requires selling into falling markets and buying into rising markets, amplifying directional moves.
This helps explain why some declines unfold gradually while others accelerate into disorderly selling.
A common reference point is the gamma flip level, where estimated aggregate dealer gamma changes sign. But dealer gamma isn’t a single on/off switch at one price. Estimated exposure shifts across strike zones: the index can sit in a pocket of negative gamma that deepens toward one strike, then turns progressively more positive approaching the next major concentration of positioning. The shape of the gamma profile matters as much as where the flip sits, particularly when liquidity deteriorates.
SpotGamma’s gamma exposure models map these zones alongside important put walls and concentrations of options positioning.
Negative gamma creates conditions where larger moves in either direction become more likely.
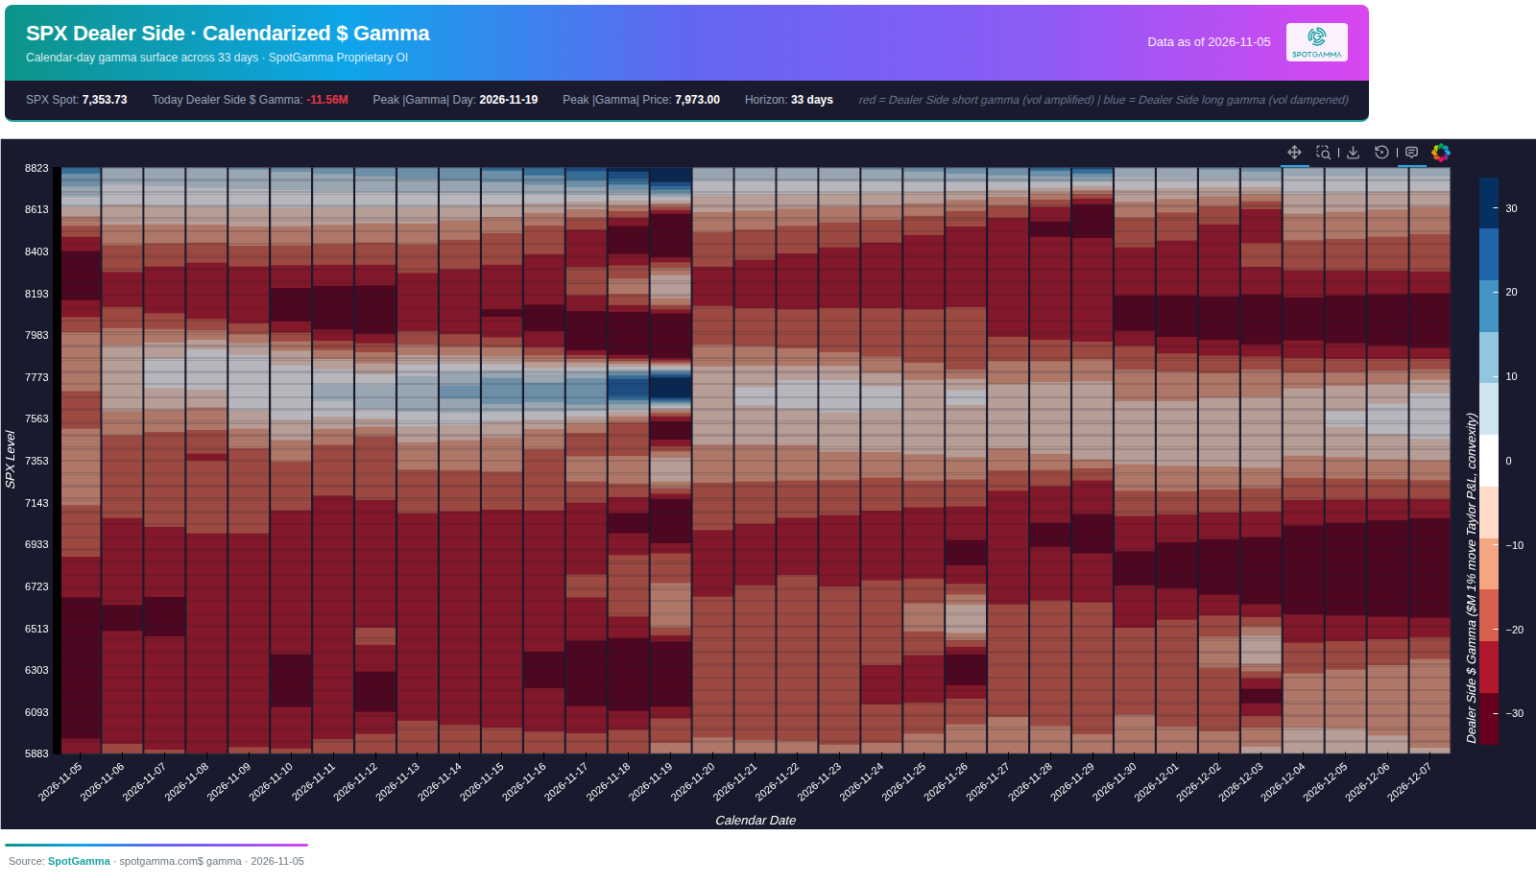
SpotGamma’s SPX dealer gamma map from Nov 5 highlights a market environment increasingly vulnerable to amplified price swings. Much of the surrounding price landscape is dominated by negative gamma (red). In these regions, dealer hedging reinforces directional moves, accelerating selloffs and amplifying rapid upside rebounds.
Much of that negative gamma is tied to positions expiring with November monthly options expiration on Nov. 20, when large blocks of positioning are set to clear. Until then, the map suggests elevated volatility could persist until positioning meaningfully shifts, even without additional negative macroeconomic catalysts.
What the VIX Isn’t Telling You
The VIX measures the market’s pricing of expected S&P 500 volatility over approximately 30 days.
A surging VIX reflects more expensive implied volatility, typically driven by increased demand for downside protection.
However, the headline reading doesn’t reveal whether elevated volatility will persist.
Three additional indicators deserve attention:
1. VIX futures term structure
Under normal conditions, longer-dated VIX futures often trade above shorter-dated contracts, known as contango.
During market stress, nearby futures can rise above later expirations, creating backwardation and signaling unusually elevated near-term volatility expectations.
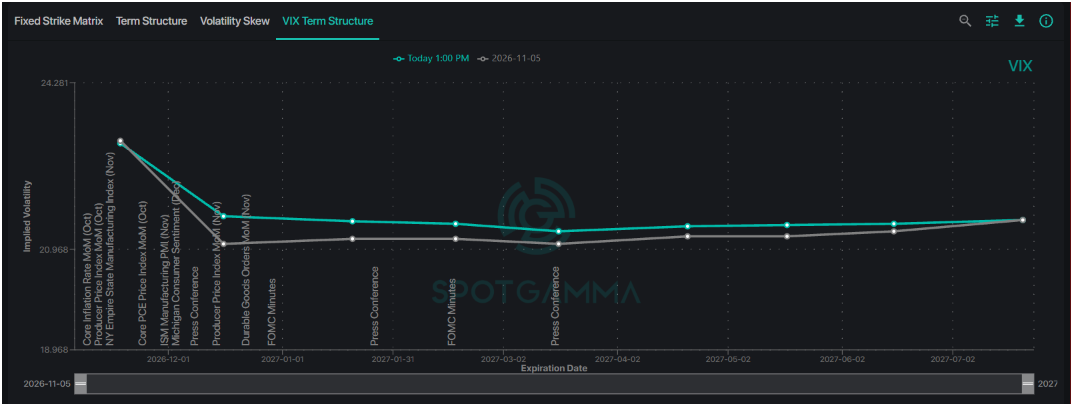
The front end of the VIX futures curve remains elevated relative to later maturities, reflecting heightened near-term uncertainty. A return toward a more normal upward-sloping curve would signal that the immediate market stress is easing.
2. Put skew
Increasing demand for downside protection makes bearish puts more expensive relative to upside calls.
Persistently elevated put skew, even during equity rebounds, signals that investors remain reluctant to remove protection.
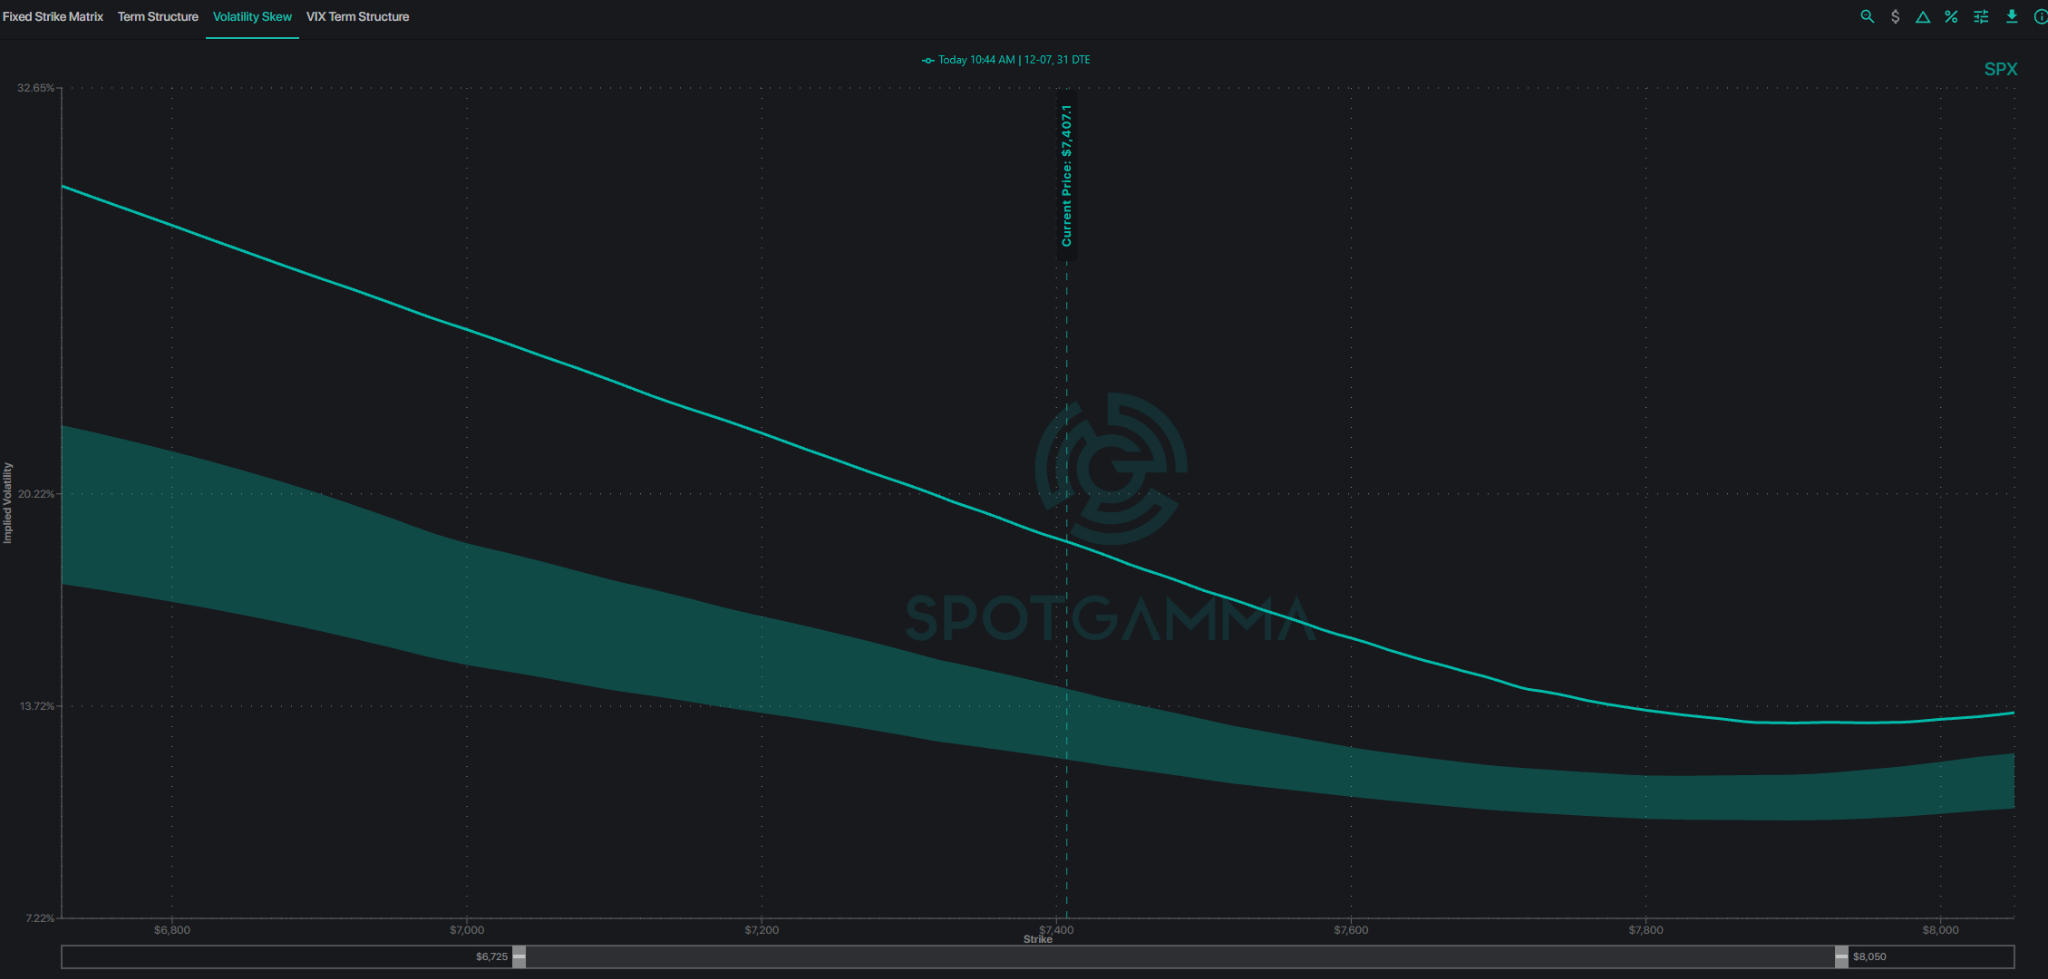
The updated SPX volatility skew reveals pronounced demand for downside protection, with implied volatility rising sharply at strikes below the current index level. This steep downside skew reflects elevated hedging demand and lingering concerns about further declines. A flattening of the curve would signal improving risk appetite.
3. Short-dated implied volatility
One-day (VIX1D) and nine-day (VIX9D) volatility measures reveal how aggressively traders are pricing immediate event risk.
A spike concentrated at the front end suggests near-term uncertainty, while broader increases across maturities indicate more persistent risk repricing.
Thursday’s repricing was heavily front-loaded. VIX1D more than tripled, closing at 36.80 from 12.08, while VIX9D more than doubled to 32.66 from 15.19. Both finished well above the 30-day VIX at 28.18. Just one session earlier, the curve sloped normally upward, with VIX9D at 15.19 sitting below the VIX at 16.61.
That inversion matters for the next two weeks. VIX9D’s nine-day window spans both the Nov. 10 CPI and Nov. 13 PPI releases, so its premium over the VIX shows traders paying up for protection through the inflation data. Until those catalysts pass, front-end volatility has reason to stay bid.
These distinctions matter because falling implied volatility can also support equity recoveries.
As protective positions lose value or are unwound, dealer hedging adjustments tied to changing volatility and delta exposure contribute to buying pressure.
This helps explain why sharp selloffs sometimes produce equally aggressive relief rallies without major improvements in fundamentals.
The November Catalyst Calendar
The timing of this volatility shock is particularly important, with several catalysts approaching before November monthly options expiration.
- November 10: October Consumer Price Index (CPI)
- November 13: October Producer Price Index (PPI)
- November 20: Monthly options expiration (OPEX)
Upcoming inflation data could reshape Federal Reserve policy expectations at a time when investors are already paying more for near-term market protection.
An upside inflation surprise could reinforce higher-for-longer interest rate expectations and prolong volatility. Conversely, softer readings that reduce policy uncertainty could encourage implied volatility to decline.
November OPEX introduces another important variable as options expire, roll forward, or unwind, potentially shifting dealer hedging exposure.
These positioning adjustments could influence market behavior even without significant changes in underlying economic fundamentals.
The priority is monitoring how volatility and dealer positioning evolve around these events rather than assuming any single catalyst will produce a directional outcome.
Three Scenarios for the Next Two Weeks
Rather than predicting an exact market bottom, traders can evaluate three potential paths using options-market signals.
Scenario 1: Selling Pressure Accelerates
The S&P 500 remains in negative gamma while demand for downside protection persists.
Rising front-end volatility, widening put skew, and continued bearish options flows would suggest vulnerability to additional liquidation.
Intraday rallies may struggle to gain traction, with wider trading ranges and potentially accelerated downside moves.
Scenario 2: Volatility Stabilizes
Equities begin consolidating as implied volatility stops rising and downside hedging demand moderates.
A transition toward positive dealer gamma exposure could help stabilize price action and encourage more balanced, two-sided trading.
This environment favors consolidation rather than necessarily signaling an immediate return to the previous uptrend.
Scenario 3: A Volatility Unwind Fuels Recovery
Declining implied volatility, reduced protective-put demand, and improving options flows could generate a sharp relief rally.
Dealer hedging adjustments may reinforce upside momentum as investors unwind defensive positions.
However, a strong rebound wouldn’t automatically confirm that the broader correction has ended.
The Bottom Line
The next phase of this correction may depend as much on investor positioning as on economic headlines.
Negative gamma can amplify price movements, elevated volatility can increase hedging pressure, and upcoming catalysts create opportunities for abrupt repricing.
Watch gamma exposure, volatility term structure, put skew, and real-time options flows together.
While no single indicator predicts every market turn, these signals provide a framework for recognizing when selling pressure is accelerating, stabilizing, or beginning to reverse.
For traders navigating November, understanding the mechanics behind volatility may prove more valuable than attempting to predict the next market bottom.